
Highlighting a range of space industry activities, The Space Report Quarter 3 conveys the most pertinent and interesting findings of Space Foundation research and analysis conducted during the quarter.
These perspectives on commercial space revenue, STEM education, and emerging jobs provide key insights into trends that continue to shape the larger space industry and how it will continue to grow and evolve.
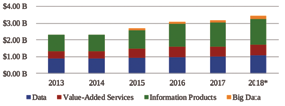
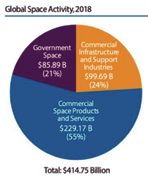
The global space economy crossed the $400 billion mark for the first time this year with revenues of $414.75 billion. Commercial space activity fueled much of that growth, with the largest single-sector gain coming from value-added services, which posted a single-year 20.5 percent increase in revenues.
Strong economic news in the space industry also was reflected in the second-quarter results of the The S-Network Space Indexsm. Of the 30 space-related companies it tracks, seven showed growth of 20 percent or more in Q2 2019. Overall, the index showed an increase of 8.7 percent and outperformed the two comparison indexes.
The full version of The Space Report Quarter 3 provides more detail regarding 2018 activities. For more in-depth and up- to-date information, The Space Report Online captures the latest and most accurate space industry data.
Both the report and database subscription are available for purchase. To join major aerospace companies, universities, research firms, and government organizations that are serious about gaining in-depth knowledge about the global space industry, see the end of this summary for purchasing details.
Global Commercial Space Activity
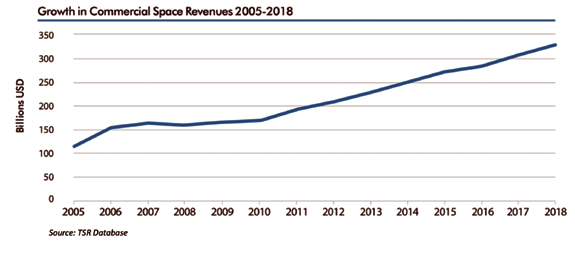
• Revenues from global commercial space activity in 2018 reached their highest levels ever, totaling $328.86 billion, an increase of 6.6 percent from 2017. Commercial revenue accounted for 79.2 percent of total global economic activity in space.
Starting in 2004, legislative mandates and private enterprise fueled a new era dedicated to space exploration and the involvement of private enterprises. From 2005 to 2018, those new efforts triggered a 13-year period of growth that resulted in a 162 percent increase in commercial space revenue.
 *Estimated Revenue: Source: Northern Sky Research, Public Filing
Commercial Space Products and Services
Commercial space products and services accounted for 69.7 percent, or $229.17 billion, of total commercial revenue, during 2018.
• In 2018, value-added services, companies that receive and use satellite signals for a range of businesses including logistics and smartphone apps, contributed the largest portion of revenue in this sector, 43.1 percent, with $98.67 billion.
• Revenues from Direct-To-Home(DTH) television were close behind, providing 42.0 percent of total revenue in this sector in 2018, with $96.31 billion.
Broadcasting
• Satellite television revenues were estimated to be $96.31 billion in 2018, based on data from the Satellite Industry Association, public filings, and industry reports.
• Revenue has been relatively steady in this area, decreasing less than 1 percent from the estimated total of $97 billion in 2017. Satellite TV providers are losing customers primarily to over-the-top services that provide on-demand content, like Netflix, Amazon Prime Video, and Hulu
• In the area of satellite radio, provider Sirius XM increased revenue by 6.4 percent over the past year, from $5.43 billion in 2017 to $5.77 billion in 2018.
Communications
Global revenue in 2018 was estimated to be $24.97 billion, 4.1 percent more than the estimated revenue of $24 billion in 2017.
Source: The Space Foundation
Earth Observation
Total global revenues for this sector were estimated at $3.45 billion in 2018, an increase of 9.4 percent from the total revenues of $3.15 billion in 2017.
Commercial Infrastructure and Support Industry
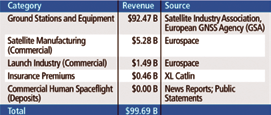
Commercial infrastructure and support industries accounted for $99.69 billion in revenue in 2018, which represented 30.3 percent of total commercial space revenue. This is 2.6 percent more than the $97.16 billion in revenue during 2017. The largest source of revenue in this area in 2018 was from ground stations and equipment, which accounted for $92.47 billion, or 92.8 percent, of total revenue in this category.
Satellite Manufacturing
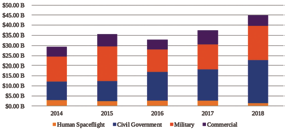
• From 2014 to 2018, the total manufacturing value of spacecraft/satellites launched each year increased almost 50 percent from just under $30 billion to $45 billion.
• The majority of that value in 2018 came from civil government and military sectors, but U.S. companies launched 167 spacecraft/satellites and earned $5.28 billion in revenue.
• Revenue from commercial spacecraft accounted for 11.7 percent of the estimated $45 billion total value of the spacecraft market in 2018. The remaining 88.3 percent, or $39.75 billion, was related to civil and military spacecraft, including cargo launched to the International Space Station as part of NASA’s commercial resupply services.
Launch
• Estimated global market value for commercial launch services in 2018 was $1.49 billion, according to Eurospace, the European space industry association. This is a decrease of 40.3 percent from the estimated total of $2.49 billion in 2017.
• Commercial launches accounted for 21 percent of the estimated total global market value for orbital launches in 2018.
• Launches for government customers accounted for the remaining 79 percent, or $5.60 billion of estimated market value.
STEM Education
This analysis of the future of the space industry examines STEM proficiency rates of primary and secondary students, subsequent STEM postsecondary graduation rates, and the familial and educational background of STEM degree recipients.
Source: Eurospace
STEM Proficiency in Primary and Secondary School
U.S.
Significant differences in STEM education can be found across public and private schools, and throughout grade levels.
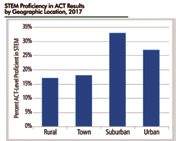
In science, eighth grade proficiency in private schools is 10 percent of that in public schools. Similarly, eighth grade technology and engineering literacy proficiency in private schools is also 10 percent higher. There’s an additional disparity between all public and big-city public schools, namely, mathematics proficiency is 8 percent lower in big cities and science proficiency is 19 percent lower.
No school location produced a STEM-interested and STEM- proficient student base greater than one-third.
International
The Organisation for Economic Co-operation and Development (OECD) surveys 15-year-olds across the world in the Program for International Student Assessment (PISA). The 2015 survey included over half a million students in 72 participating countries, creating a baseline of STEM proficiency on a global scale
On a regional scale, Asia outperformed other continents, containing three of the top five nations in science proficiency, and all five of the top five nations in mathematics proficiency
On the other end of the spectrum, 46 percent of students surveyed scored an average of Level 2 or below on mathematics and in science. Of these, about 25 percent scored a Level 1 in science and over 30 percent scored a Level 1 in mathematics.
Postsecondary Degrees in STEM
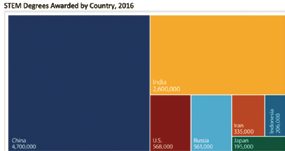
The U.S. awarded only 6 percent of all STEM degrees awarded globally in 2016— approximately 568,000.
Source: STEM Education in the U.S.: Where We ARE and
What We Can Do — 2017, ACT
China produced eight times as many — 4.7 million — and more than half of all STEM graduates in 2016, followed by India (28 percent). Taking national population into account, Iran produced the greatest number of STEM graduates per capita (1:238), followed by Russia (1:258), and China (1:294). For comparison, the U.S. STEM graduate rate per capita landed at 1:569.
Emerging Jobs
According to Pew Research, U.S. STEM employment has grown 79 percent since 1990. The Bureau of Labor Statistics tracked a 10.5 percent increase in employment (approximately 800,000 jobs) across all U.S. STEM occupations between May 2009 and May 2015. U.S. STEM employment in May 2015 reached 8.6 million, accounting for 6.2 percent of total U.S. employment. The Bureau of Labor statistics predicts 2.6 million U.S. STEM job openings between 2014 and 2024, with the most dramatic growth projected in mathematical science occupations.
• With the sub-baccalaureate workers included, STEM jobs represent 20 percent of all U.S. jobs. By this metric, as many as 26 million jobs in the United States require significant STEM knowledge and skills in at least one STEM-related field.
• A 2014 Business RoundTable survey projected that during the next five years, major American companies will need to add a total of nearly 1.6 million employees to their workforce: 945,000 who possess basic STEM literacy and 635,000 who demonstrate advanced STEM knowledge.
• One in three workers ages 25 and older that have at least a bachelor’s degree in a STEM field of study, but only about half (52 percent) of these STEM-trained workers are employed in a STEM occupation.
• The U.S. Census Bureau even reported in 2014 that 74 percent of those who have a bachelor’s degree in a STEM major are not employed in STEM occupations.
Source: World Economic Forum.
S-Network Space Indexsm
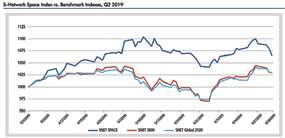
The S-Network Space Indexsm tracks a global portfolio of publicly traded companies that are active in space-related businesses and compares their performance against two other indexes. The S-Network 3000 tracks the 3,000 largest U.S. stocks by market capitalization, and the SNET Global 2500 tracks a combination of the 1,000 largest U.S. stocks, 500 largest European stocks, 500 largest Pacific basin stocks (developed), and the 500 largest liquid Emerging Market stocks.
In Q2 2019, the 30 space companies the met the financial requirements for inclusion in the Space Index significantly outperformed the S-Network US Equity 3000 Index (SNET 3000) and the S-Network Global 2500 Index (SNET
Global 2500).
Report Purchasing Options
The Space Report serves as a resource for government and business leaders, educators, financial analysts, students, and space-related businesses. For more than a decade, The Space Report has chronicled the growth of the space community from around the world.
The Space Foundation’s Research & Analysis team produces The Space Report, and earlier this year transitioned its annual summary into quarterly updates of global space activity.
Note: Performance shown for each index is for the gross total
return, assuming all dividends are reinvested.
This new format makes it possible to provide the most up-to-date information on space infrastructure, facilities, launches, and programs. Similar to other major economy- measuring indicators that inform our awareness of what is happening around the world, the quarterly installments of The Space Report are designed to improve our discussions and understanding of the reach, impact, and health of the
space community.
To purchase The Space Report 2019, or to subscribe to The Space Report Online, go to thespacereport.org/pricing.
For more information about the availability, pricing, and delivery of The Space Report, please contact TheSpaceReport@SpaceFoundation.org.
For questions related to The Space Report content, or the space industry in general, or a request for customized research by the organization’s Research & Analysis team, please contact Research@SpaceFoundation.org.