

With the launch of new high capacity, Low Earth Orbit (LEO) satellites that migrate across the sky, and the increasing importance of high speed communications from moving vehicles, ships, or planes, the need for accurate tracking between the satellite and its ground terminal remains as important as ever.

While most ground terminals track acceptably under benign conditions, tracking the satellite can still remain problematic at higher frequency bands (when the beam is more directional), at higher relative velocities or turbulence, or in obstructed environments. The true test of tracking ability comes in rough terrain, tight turns, or when passing near obstructions.
In this article, the use of ‘monopulse’ technology in mobile ground terminals to provide unsurpassed tracking performance is demonstrated.
Satellite Tracking Design Approaches
In frequency bands where high antenna gains are required and beams are directional, there are two broad approaches to acquiring and then tracking the satellite from the ground terminal.
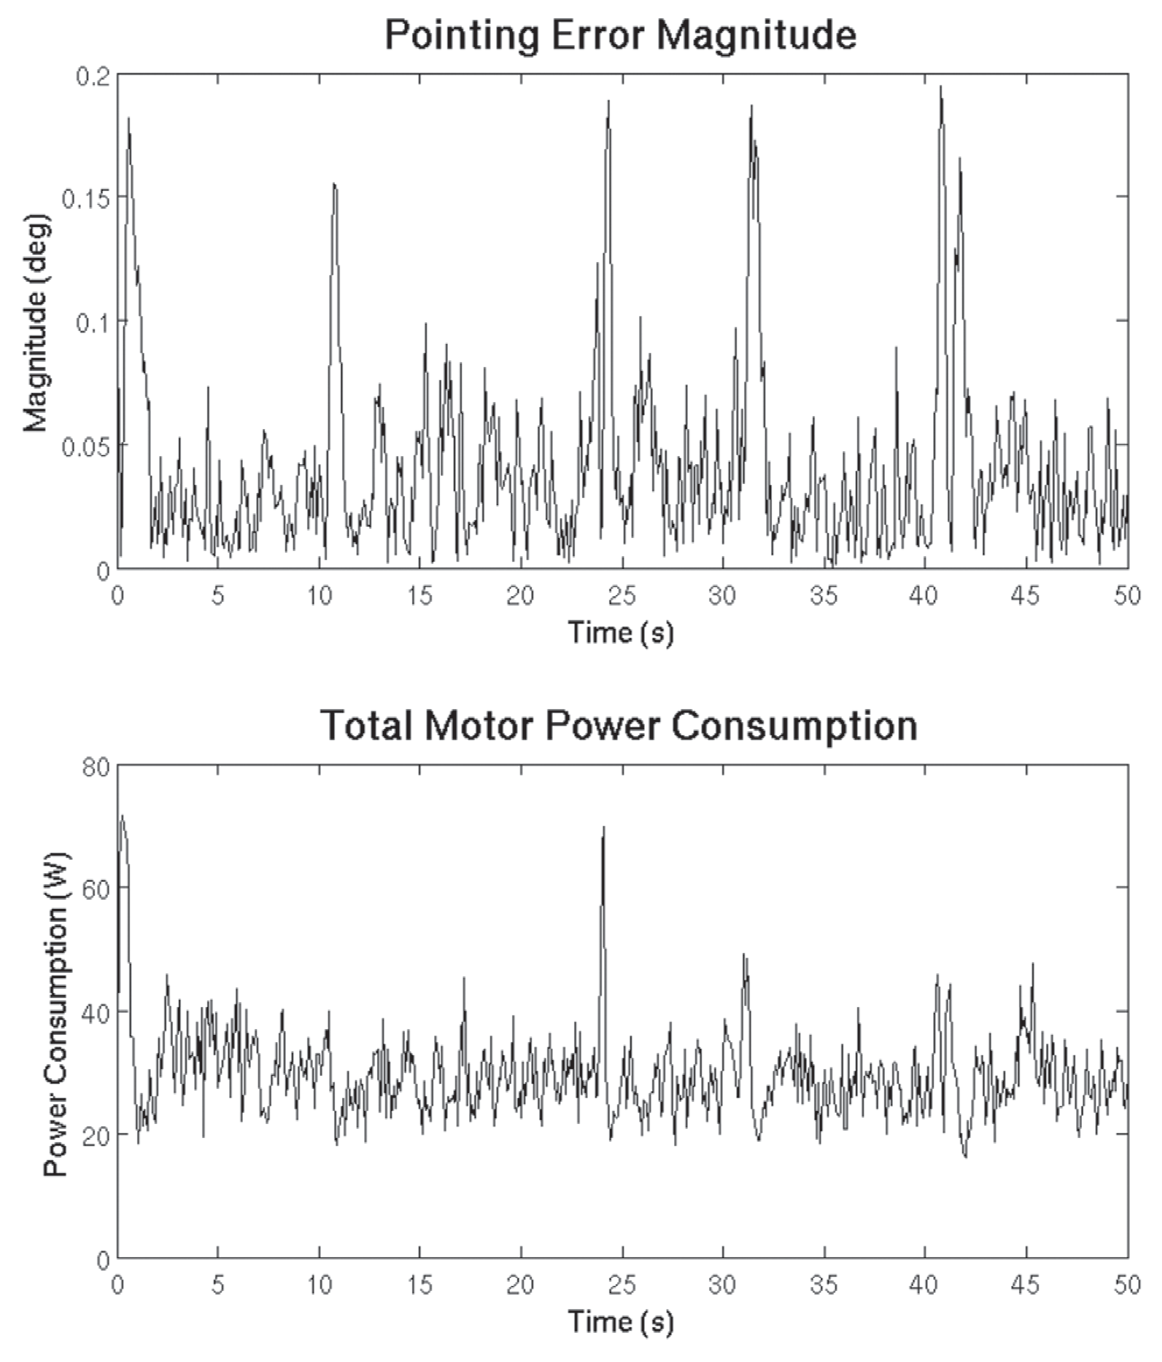
Figure 1. A real-time plot of the pointing error and motor power during a typical off-road trial for a Ka-band EM Solutions on-the-move satellite ground terminal.
The first, which is an open-loop approach, is to use the known position of the satellite in the sky to orient the antenna, and to reorient the antenna given the terminal’s current heading. However, pointing accuracy to within a fraction of a degree is very difficult (and expensive) to achieve with an open-loop tracking system that relies solely on inertial measurement systems to steer the antenna. Furthermore, inertial measurement systems that rely on GPS measurements cannot account for signal refraction through the radome, and are therefore susceptible to radome variations and large offset errors that also depend on the angle of incidence.
GPS-assisted inertial units are also quite sensitive to multipath, so moving in the vicinity of buildings or trees could upset the INU (Inertial Navigation Unit), which would then result in pointing errors. To make matters worse, it would be very hard to know that these pointing errors had occurred, since such a system does not report on the actual pointing error.
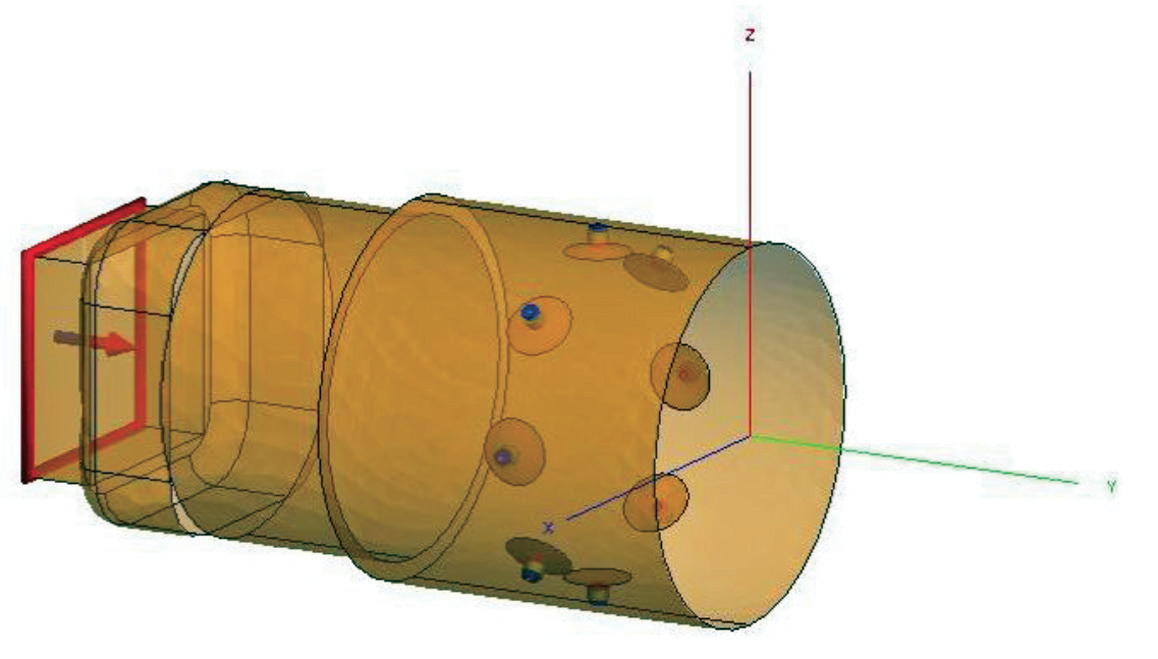
Figure 2: An X-band feed horn showing probes around the diameter of the horn to sample the amplitude and phase of the TE21 signal generated within the feed.
The second, a closed-loop approach, is to track the satellite using its own transmissions. The terminal could, for instance, seek the orientation that maximizes the receiver signal, or satellite beacon signal, or some other derived signal, as in a “monopulse” system.
The signal maximum has a rather broad beamwidth, and finding its peak (at the center) requires mechanically scanning a conventional reflector antenna across the sky. Two examples of mechanical scanning systems are conical scan and step-track. These are deployed in so-called on-the-hop terminals, which remain stationary in operation once deployed on location, but also in on-the-move terminals. However, a deliberate pointing-error must be introduced to verify the maximum has been reached, and this reduces the gain and effective power received; and can also respond too slowly for rapid vehicle motions. Furthermore, with mechanically scanned systems, fluctuations caused in the peak signal amplitude by signal modulation, obstructions or scintillation will also confuse the system and can result in loss of tracking altogether.
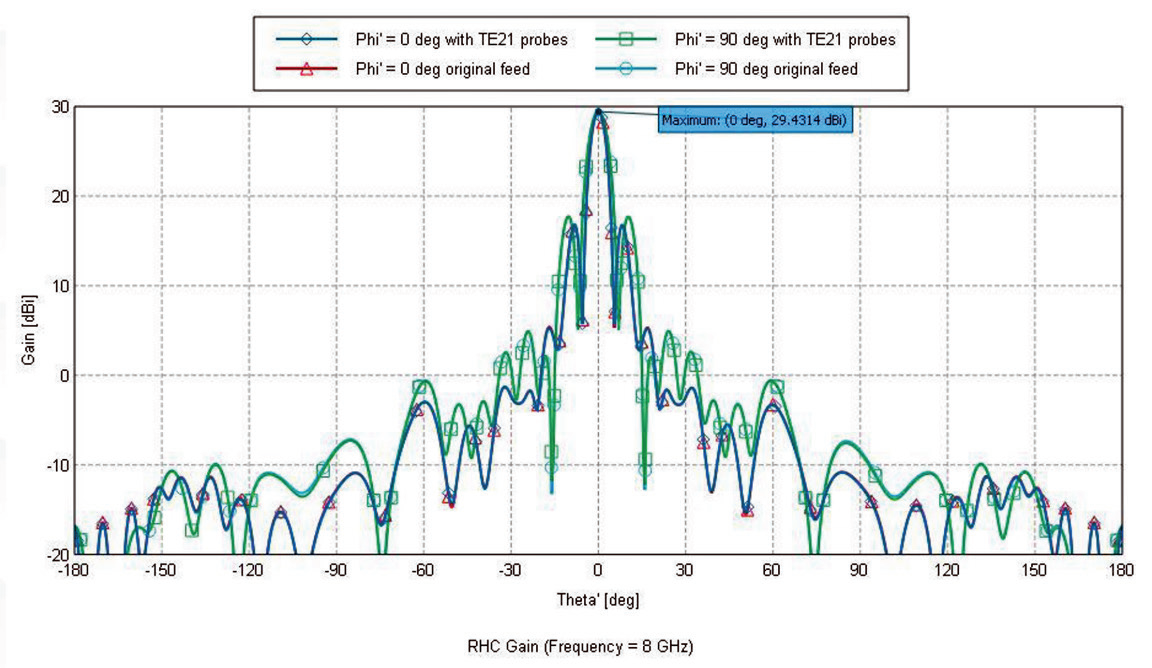
Figure 3. A plot of the radiation patterns of an X-band antenna feed with and without the TE21 probes, according to numerical modeling at 8GHz (Right Hand Circular polarization)
For all its on-the-move terminals, EM Solutions uses instead a variant of so-called ‘monopulse’ tracking, since it alone provides the most certainty and accuracy as to the true boresight direction. Monopulse systems are able to estimate the pointing error without any intentional scanning and without needing to deliberately mis-point the antenna.
Monopulse antenna systems are essential in large earth stations which have a very narrow beamwidth. Until quite recently, monopulse feeds have been too cumbersome and large to deploy in smaller terminals, since they require measuring a higher order mode pattern within the receiver feed.
One pattern, the fundamental mode (TE11 in circular waveguide), has the conventional antenna pattern for data communications, while higher order mode patterns (TM01, TE21, TM11 etc) have sharp nulls along the bore-sight. These modes can be used for more accurate pointing, since when the antenna is directly along boresight to the satellite, the power in the higher order modes in virtually nil. If the antenna moves off boresight, the level in the higher order modes increases rapidly. By continuously comparing the amplitude and phase change of a selected higher order mode with the fundamental mode, the antenna can be kept almost perfectly aligned. The deviations from boresight can also be calculated to give a continuous estimate of pointing error.
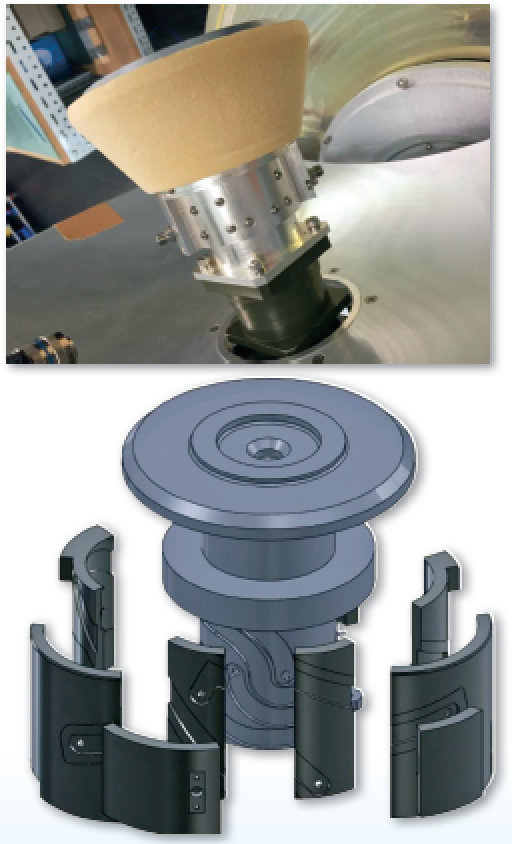
Figure 4. Photograph (upper) of an X-band antenna feed horn, and schematic (lower) of the waveguide-based network used to generate the required monopulse signals from the TE21 probes and route them to the receiver and antenna control unit for processing.
EM Solutions prefers to select the TE21 mode, as this can be used for both linear and circularly polarized signals, and the TE21 network can be designed to have quite a sharp null with high TE11 rejection, thus minimizing any deviations from boresight. It is important, of course, that the TE21 network has negligible effect on the fundamental TE11 signals in both transmit and receive. Otherwise this could compromise the antenna patterns, the G/T and the EIRP of the terminal.
Estimating Pointing Error
When through its own motion the antenna feed deviates away from boresight and the sharp null of the TE21 mode is lost, the feed detects a non-zero amplitude and phase in the TE21 signal that is proportional to the amount and direction of the deviation. This pointing-error signal can be used in a control loop to steer the beam back to the correct orientation from its current position.
A monopulse system is able to report its measured pointing error to indicate the pointing accuracy achieved at any instant. Apart from being used to mute transmission when not accurately pointed to the satellite, measurement of pointing error also allows the availability of the system to be calculated.
A typical plot of pointing error during an off-road trial is given in Figure 1. Since the antenna uses a single parabolic reflector, both Rx and Tx beams are identically aligned. The pointing error is generally less than 0.1 degree over the full elevation coverage, indicating near-perfect continuity of communications even in the most demanding motion environment.
For this antenna, 0.1 degrees is about 6 percent of the 3dB beamwidth so the drop in magnitude of the transmit and receive levels is negligible. The motor power consumption is also shown, demonstrating that because of the mechanical balance achieved by the system, only a small component of the overall power budget is used for steering the antenna and maintaining lock. Power is required only to repoint the antenna, not to keep it actively scanning.
A monopulse system requires a special antenna feed to generate the TE21 mode, as well as a second receiver chain to determine the pointing error from it. All antenna systems on EM Solutions’ OTM terminals are designed with a number of properties that enable this. These include:
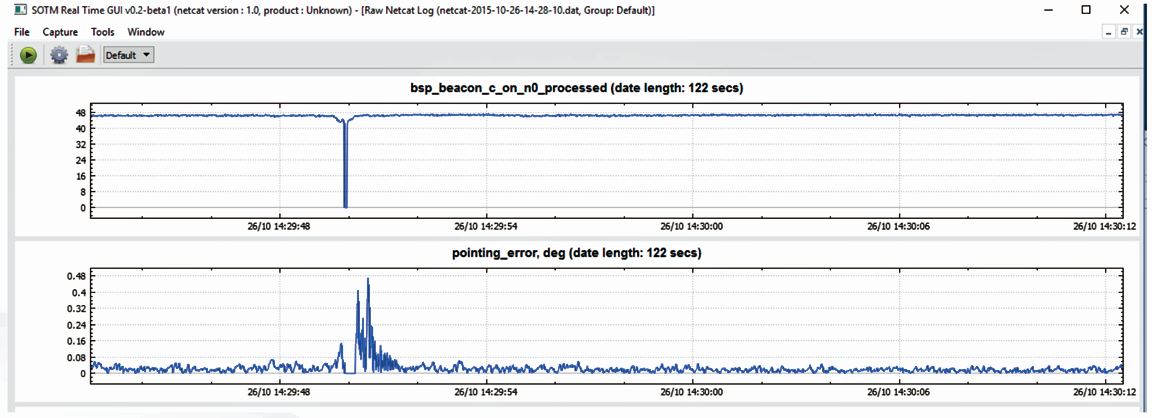
Figure 5. Example of real-time recorded data output. The top plot shows the received C/No level of the fundamental signal, and the bottom plot the pointing error at the same time
• The diameter of the feed must be large enough to propagate both the fundamental and TE21 modes in the receive band, and the fundamental mode in the transmit band
• Sufficient narrowing of the feed to provide a good return loss for the TE21 mode
• Use of a ring-focused antenna and a suspended substrate network with probes around the feed in the radiation pattern 'dead zone' to extract the TE21 mode
The TE21 signal can be extracted via coupling slots or probes. At Ka-band frequencies, waveguide slot coupled networks are small enough to be designed around the feed. At X band, a TE21 waveguide network would be prohibitively large for most mobile antennas, so a coaxial probe with planar circuit approach is used to make the TE21 network.
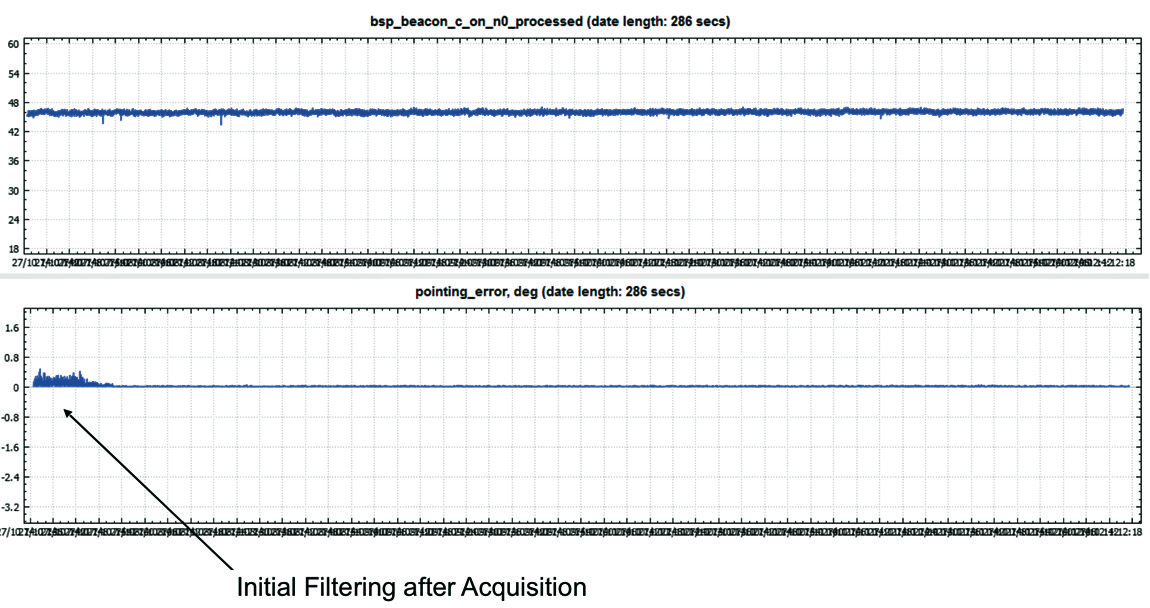
Figure 6. No Motion
One approach to extract the TE21 mode is to add capacitively loaded probes about half way along the largest diameter section of the feed horn, where they couple effectively to the TE21 mode (see Figure 2). For the best results, the use of 8 probes gives full network symmetry and allows the system to use either RHCP, LHCP, or LP.
It is important that the presence of the probes does not affect the data transmit and receive pattern of the antenna in the fundamental (TE11) mode used for the main data signal. For the X-band example in Figure 2, numerical modeling at 8 GHz showed that the patterns with and without the probes are almost indistinguishable, as shown in Figure 3. This is as expected, since the azimuthal periodicity of the probes and their connections, together with the modal cut-off frequencies of the relevant feed section, prevent the generation of new modes which could alter the designed pattern of the feed.
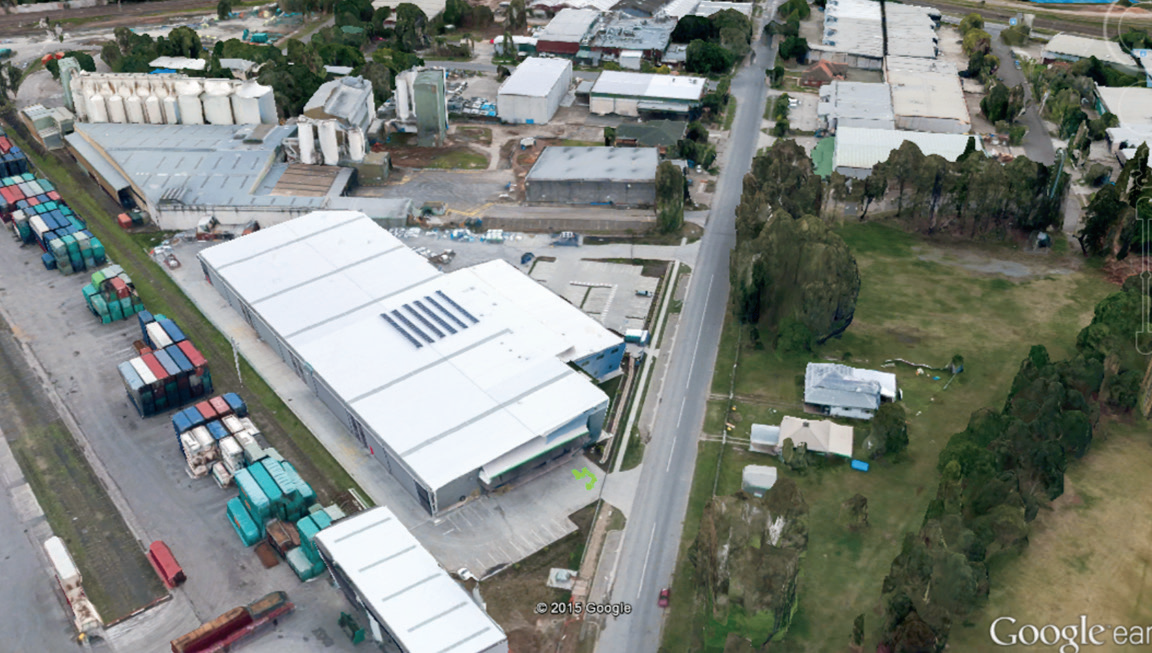
Figure 7. Google Earth Track No Motion As expected, the signal level is constant and the pointing error is zero, indicating continuous and steady operation
At the outputs of the TE21 probes, EM Solutions uses planar circuits in waveguide to generate the sum and difference signals from various combinations of the probes, and routes these behind the antenna to the antenna control unit for processing. The waveguide network wraps around the feed itself, and takes advantage of the dead zone under the antenna subreflector to avoid impacting the fundamental antenna pattern. Figure 4 shows an X-band monopulse feed.
Tracking Test Sequences Prove Superior Performance
EM Solutions COTM terminals automatically output approximately 50 variables detailing performance during operation. These are recorded 128 times per second, and include the measured pointing error and signal strengths.
Some of the more useful plots that can be obtained from the data in addition to the pointing error are the C/No level of the received signal and the azimuth and elevation position of the antenna system itself.
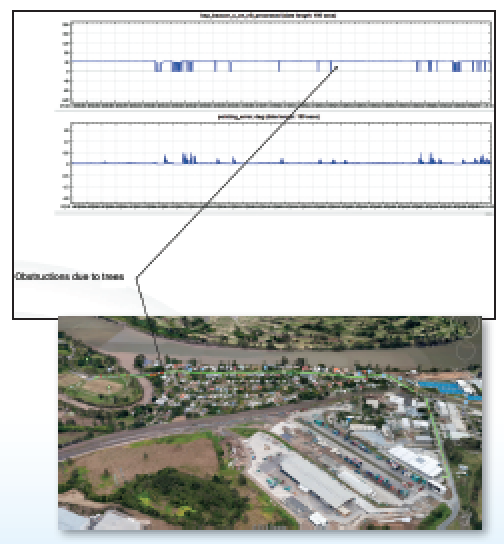
Figure 8 (top). Sealed Road Driving
Figure 9 (bottom). Google Earth Track Sealed Road
Figure 5 shows some of the important points in the plots. The top curve, of the signal C/No, shows steady tracking of the satellite except for a momentary drop in C/No caused by an obstruction. The bottom curve, of the reported pointing error, shows a steady state error close to zero, but that momentarily increases to 0.4 degrees during the obstruction.
After the signal is reacquired, the pointing error briefly peaks until the satellite is reacquired. During this time, the block up converter (BUC) would be muted to avoid false transmission, but tracking would be predicted and still continue, based on input from the terminal INU and gyroscopes to compensate for motion until the satellite was reacquired. This ‘gyro-hold’ mode minimizes reacquisition time since the terminal is already pointing close to the satellites predicted position.
In the example test sequences shown below, EM Solutions has included Google Earth plots showing the track taken by the vehicle recorded by the on board GPS. Obstructions are noted in red, and clear ‘line of sight’ is noted in green. Obstructions observed by the tracking system can then be checked against trees or buildings on the Google Earth image.
Test Sequences
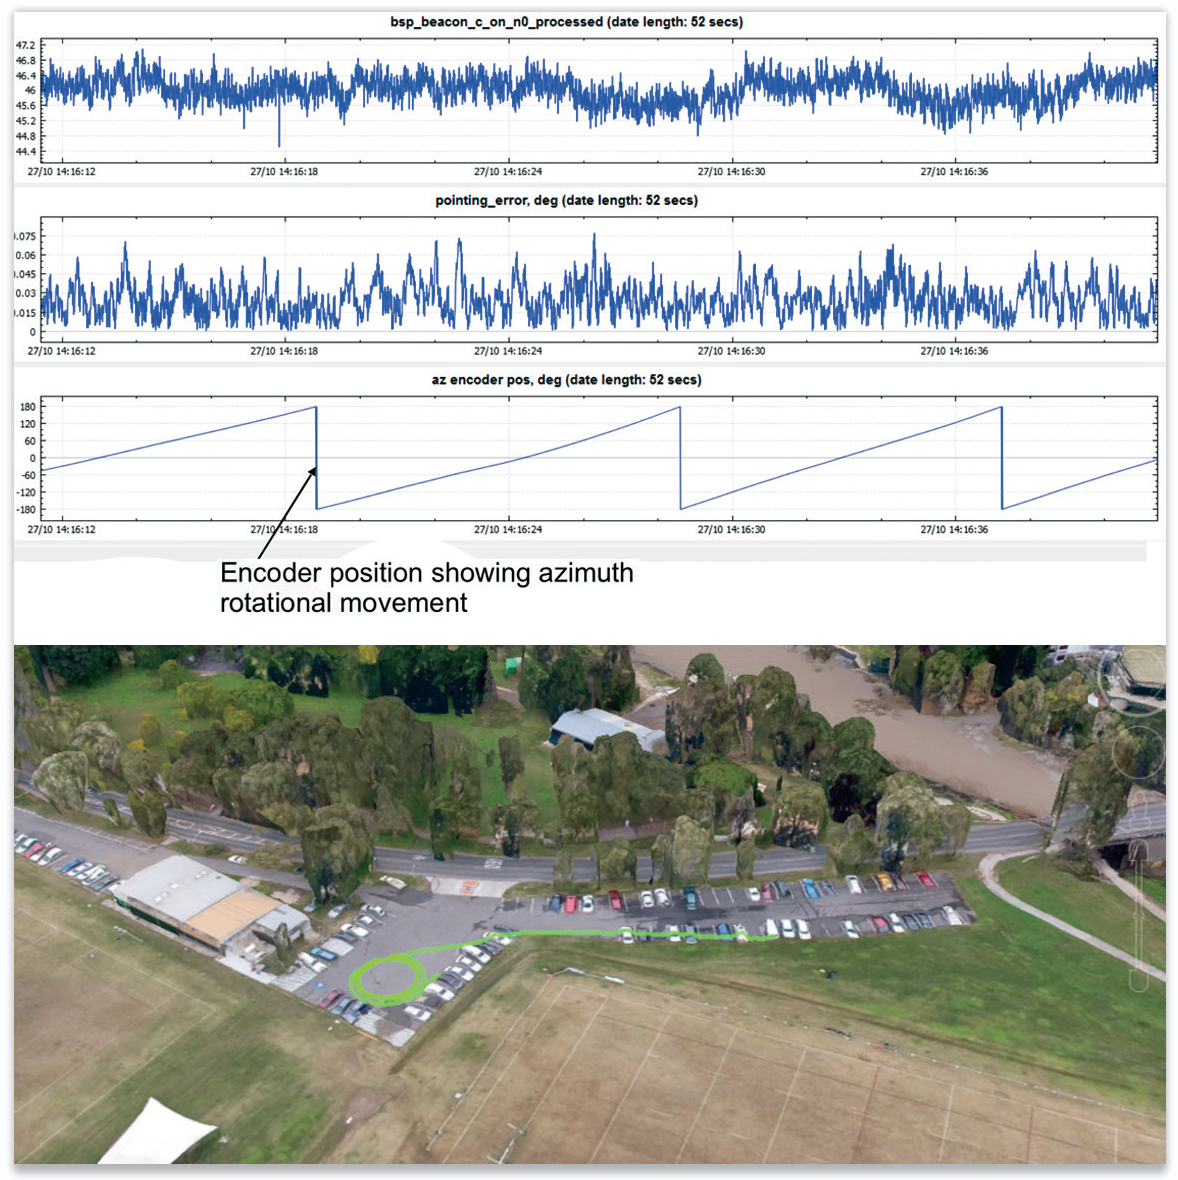
Figure 10 top. Clockwise Turns. The bottom plot shows the azimuth angle (heading).
Figure 11 bottom. Google Earth Track Clockwise Turns
A — No Motion
The simplest test is when the vehicle is not in motion and stationary.
B — Driving to the Test Area
This example shows the vehicle being driven along sealed roads to a test area, encountering occasional obstruction from trees (shown in red on the Google Earth plot). The C/No drops to zero during those obstructions, the terminal switches to its gyro-track mode, and the pointing error is generally less than 0.2 degrees.
C — Continuous Turns
When the vehicle is driven in a series of clockwise turns, the azimuth recorder shows a continuously increasing angle. The C/No remains strong, fluctuating a fraction of one dB, and the pointing error remains less than 0.1 degrees. The system remains continuously locked onto the satellite.
D — Figure of Eight Turns
This is a test that many terminals fail. When the vehicle is driven in a series of figure of eight turns, the azimuth recorder shows an angle that varies between +180 and -180 degrees. The C/No remains strong, fluctuating a fraction of a dB, and the pointing error remains less than 0.1 degree.
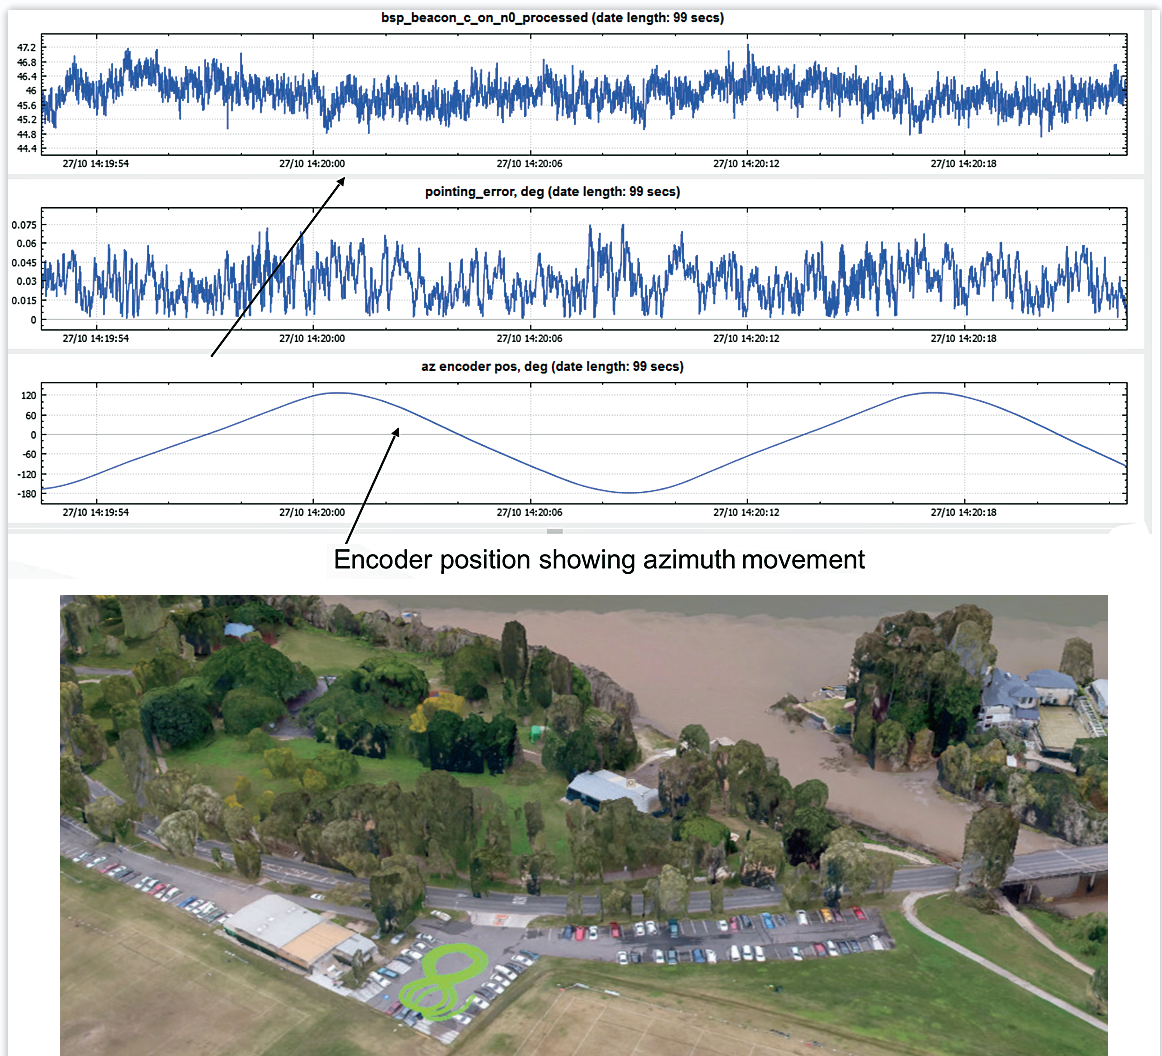
Figure 12 top. Figure 8 Turns
Figure 13 bottom. Google Earth Track Figure 8 Turns
E — Speed Bumps and Obstructions, Urban Environment
This test shows the impact of speed bumps and obstructions due to buildings. For certain obstructions, the pointing error is represented by a value of -1deg during the obstruction (as shown below). This value is used by the internal firmware only to indicate signal loss. The terminal is not affected at all by the speed bumps (the elevation encoder records the angular jerks but the pointing error remains constant), and the terminal instantly reacquires once the satellite comes back into view.
F — Underpass (10 seconds)
This test shows the impact of longer obstructions, in this instance generated by an underpass of approximately 10 seconds. The terminal reacquired the satellite immediately after emerging, remaining pointed at the predicted satellite position during the obstruction because of its gyro hold mode.
G — High Speed Drive with Rapid Acceleration and Hard Brake
This test was a high speed drive along sealed road with sudden acceleration and then braking applied. The pointing error remained less than 0.1 degrees to throughout.
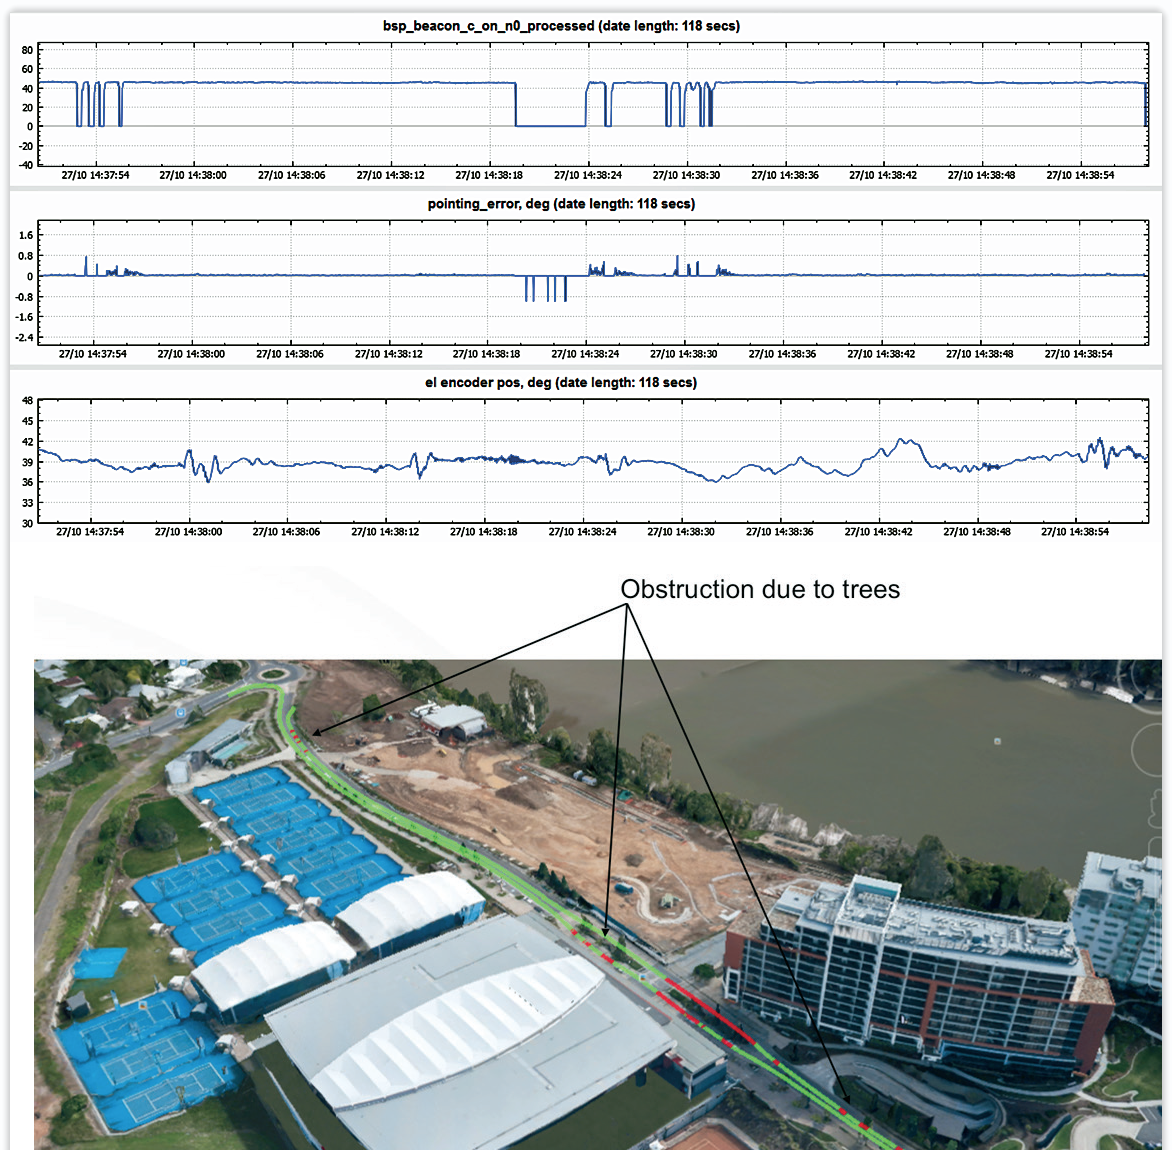
Figure 14 top. Data over Bumps and Urban Obstruction. The bottom plot shows the angle (in the sky) recorded by the elevation encoder.
Figure 15 bottom. Google Earth Track - Speed Bumps and Building Obstruction
H — High Speed, Off-Road (‘Churchill’ terrain)
The most severe test on land is off-road. Figure 20 shows an example of both the elevation and cross elevation axis tracking error and associated histogram plots, while Figure 21 shows an example of the tracking error and carrier to noise plot.
Conclusion
The use of a monopulse tracking system on small on-the-move satellite ground terminals is not cost free. The monopulse technology requires a more complex antenna feed system to generate a second antenna pattern that can be used for steering (the TE21 mode), and a second receiver chain to generate from this a pointing error control vector that can be used within an antenna control unit to steer the antenna.
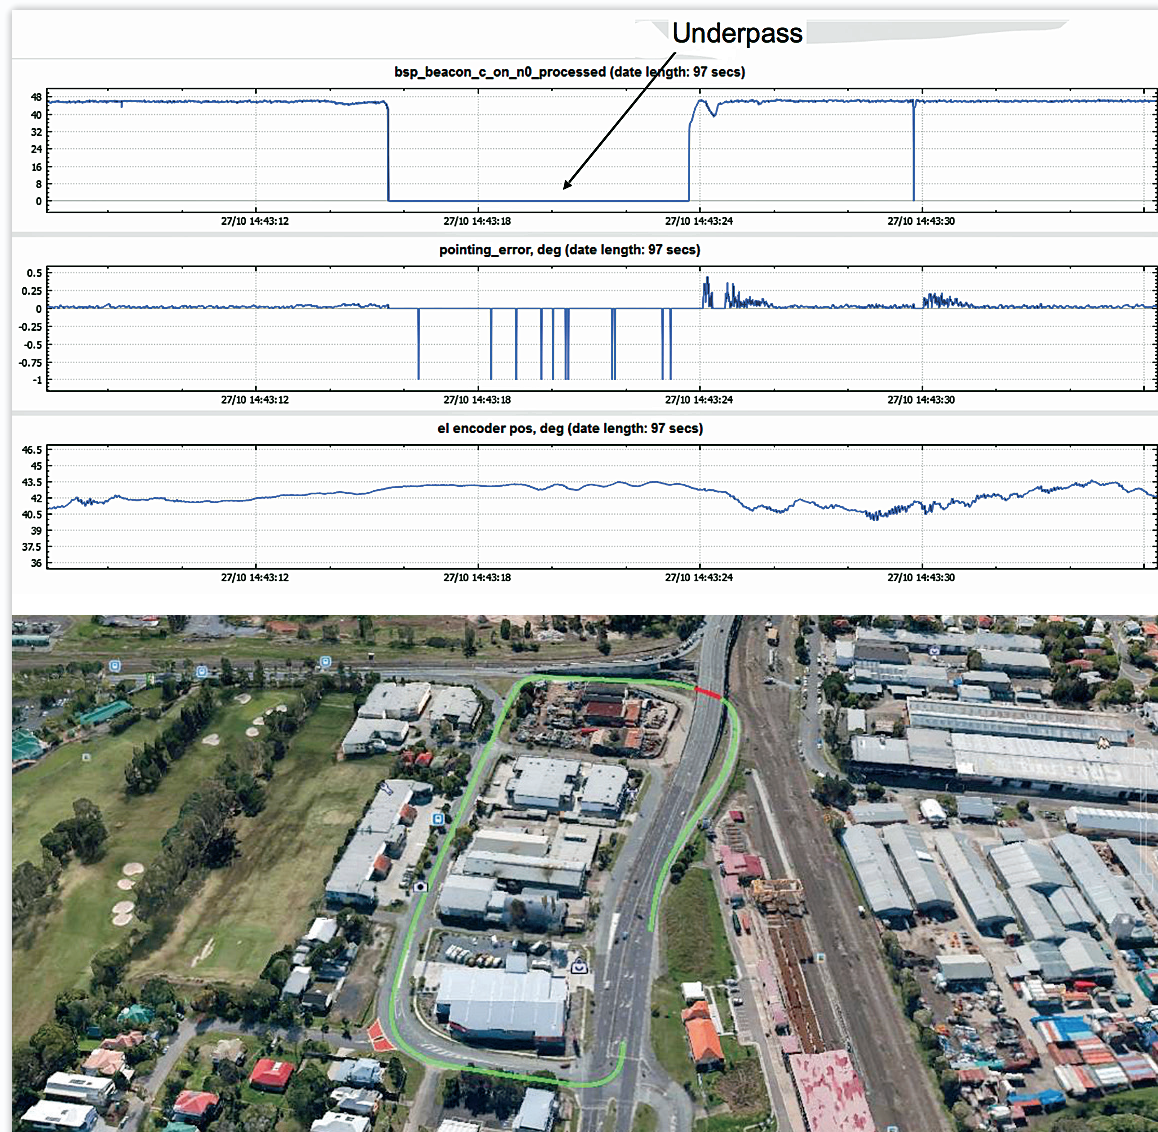
Figure 16 top. Underpass
Figure 17. Google Earth Track Underpass
However, field tests and customer reports have proven that such a system is far more reliable and robust at acquisition, tracking, and reacquisition of the satellite than other systems. The ability of a monopulse tracking system to report its own pointing error indisputably proves that tracking performance is accurate to within millidegrees as long as the satellite is not blocked.
For clients requiring maximum link availability and up-time, and more assured communications, the additional capital cost of a monopulse-steered ground terminal is negligible compared to the additional bandwidth costs and interruptions to service caused by inferior mechanically scanned systems. A single monopulse controlled system can be used to compensate for motions induced in any operating environment, whether on land, sea, or air.
emsolutions.com.au/
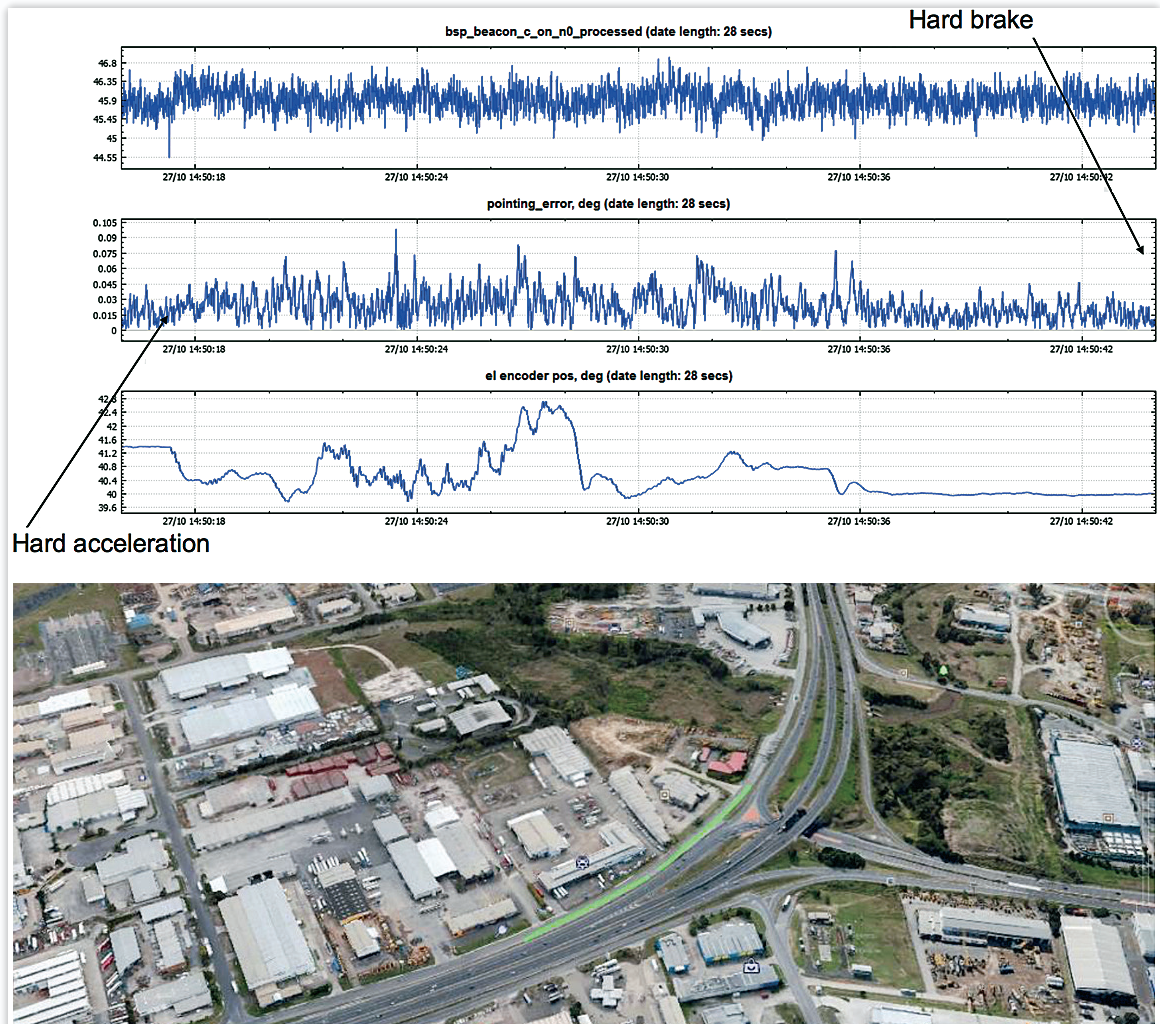
Figure 18 top. Rapid Acceleration + Hard Brake
Figure 19 bottom. Google Earth Track Rapid Acceleration + Hard Brake
Rowan Gilmore joined EM Solutions as a Director in 2007 and became Managing Director and CEO in October 2011. His role is to lead EM Solutions to achieve its vision to become recognized internationally as the leading designers and manufacturers of the most innovative and highest quality microwave product technology.
Rowan will be known to those in the microwave engineering community who have attended his short courses on microwave circuit design and RF wireless systems offered by Besser Associates and CEI Europe since 1990.
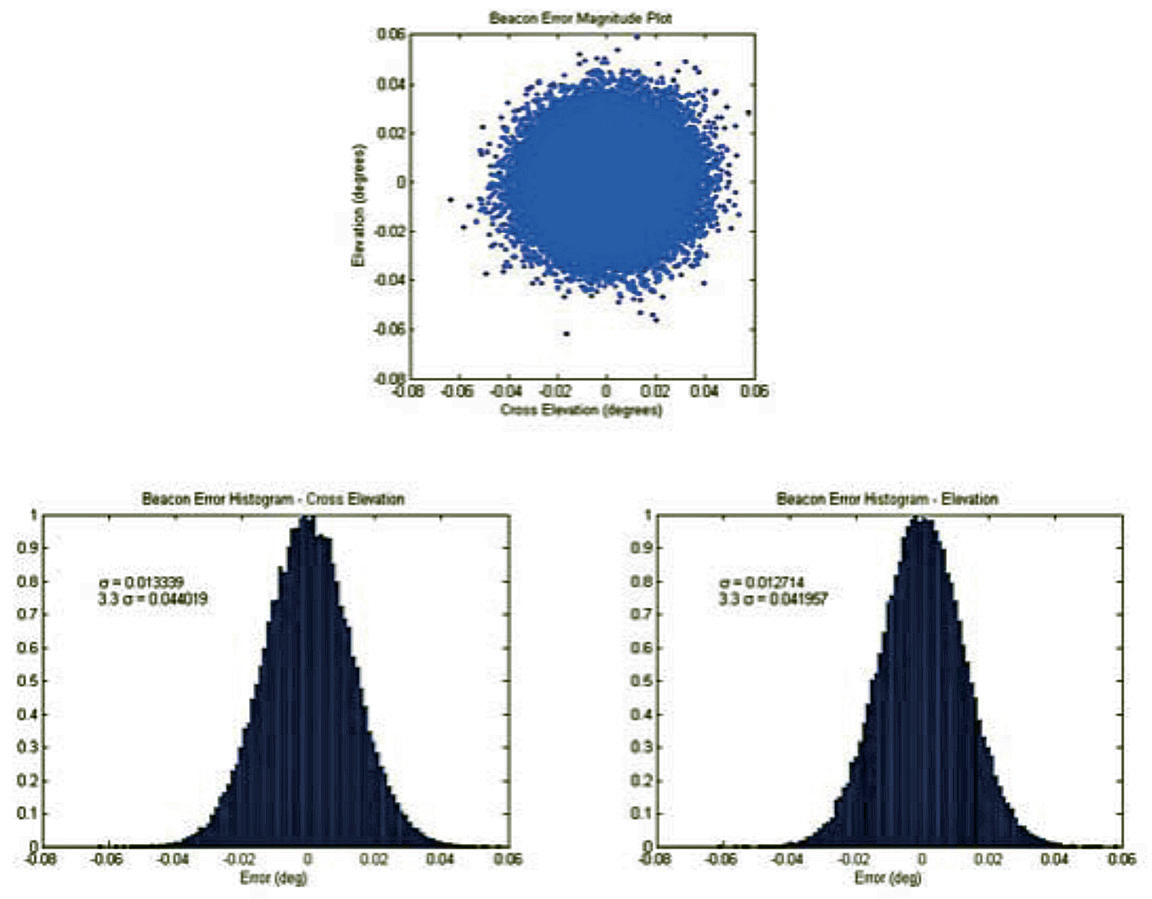
Figure 20. Off-road Elevation and Cross Elevation Tracking Error and Histogram Plots for an EM Solutions 3-axis OTM terminal (a) Beacon Tracking Error Magnitude in the Elevation and Cross Elevation Axis (degrees) (b) Cross Elevation Beacon Tracking Error Histogram (c) Elevation Beacon Tracking Error Histogram
His previous experience includes Vice President, Engineering at Compact Software, where he introduced the world’s first harmonic balance nonlinear circuit simulator, and as Vice President, Network Services Europe for SITA-Equant, the global airline IT company, now part of France Telecom’s Orange network. Most recently he was CEO of the Australian Institute for Commercialisation, where he helped numerous start-up companies and worked to accelerate technology transfer between research institutions and industry.
Rowan obtained his D.Sc. in Electrical Engineering from Washington University in St Louis. He is an adjunct professor of both Business and Electrical Engineering at the University of Queensland, and was elected a Fellow of the Academy of Technological Scientists and Engineers in 2009.
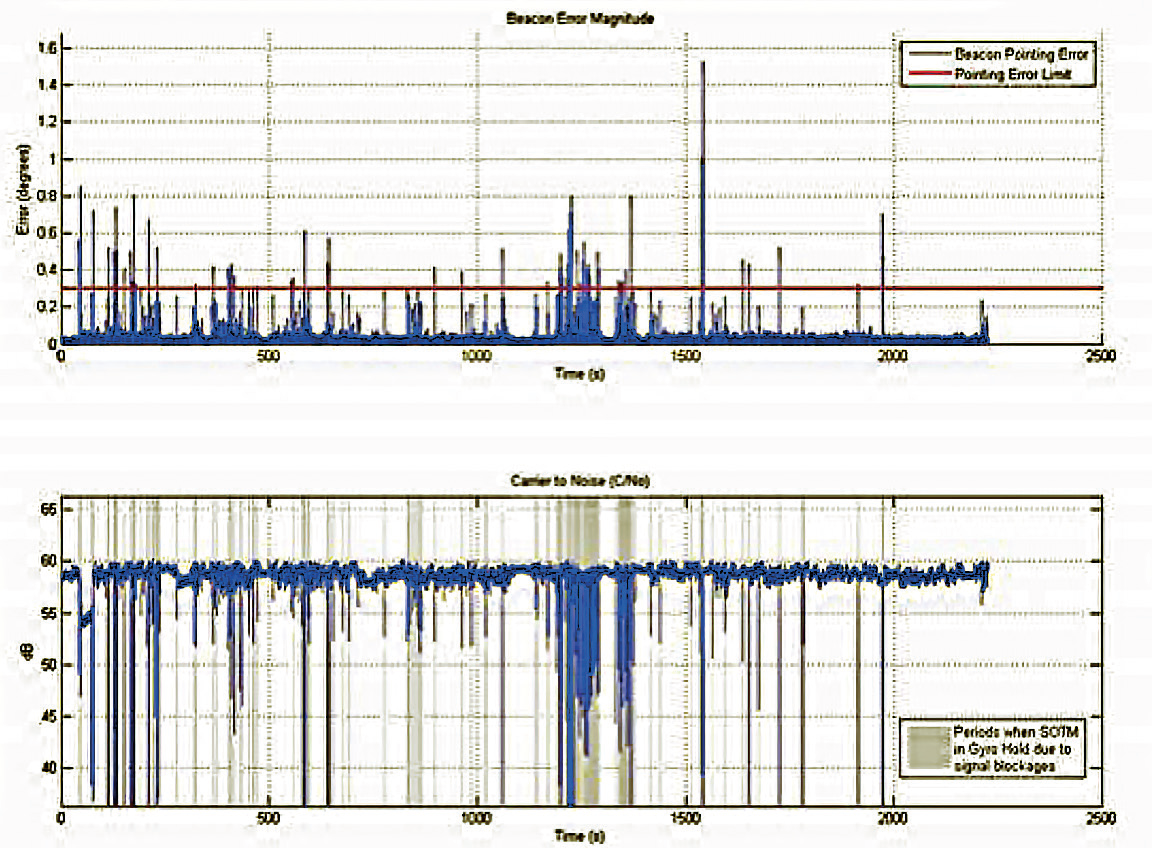
Figure 21: Magnitude of Pointing Error (top) and Carrier to Noise Plots (bottom) Recorded over Rugged Off-Road Terrain. The pointing error only exceeds specification of 0.3 degrees when the signal is lost due to blockages, as indicated on the C/No plot. The time scale now extends over nearly one hour.
Author's note
EM Solutions wishes to acknowledge the valuable support and collaboration of Indra Sistemas SA of Spain in the development and testing of the X-band terminal described in this article.
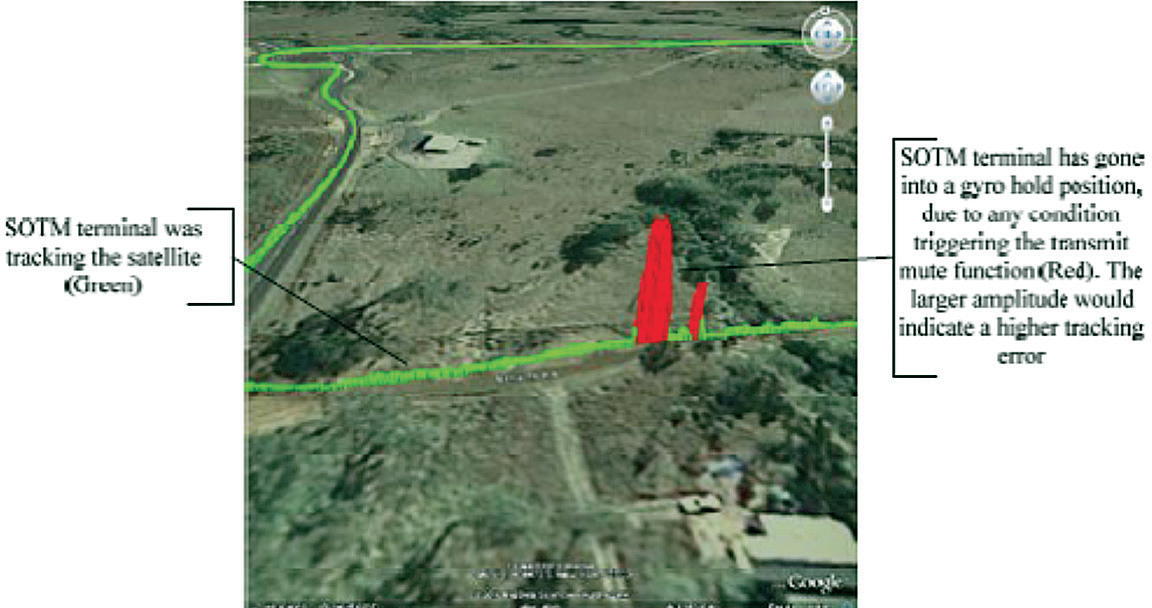
Figure 22. Example Google Earth Image of Vehicle Path and Tracking Performance Off-Road