
As radar systems require higher target tracking resolution, and communications systems require higher data throughput, modulation schemes on related signals are becoming wider in order to achieve these goals.
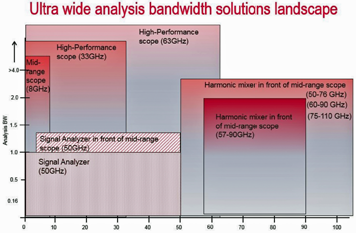
Figure 1. Applicable tools as a function of signal carrier frequency and spectral width
Some systems have crossed beyond 1 GHz and even 2 GHz-wide modulation formats. For such applications, another approach besides the traditional spectrum or signal analyzer is required to make wideband measurements that can handle such signals. This article explores how high bandwidth real-time oscilloscopes can be used to make high quality, insight-providing wideband RF measurements.
In this article, the basics of wideband time domain capture of RF/uW/mmW is considered, including main oscilloscope-based measurement options, as well as basic RF measurement performance possible including noise density, SFDR, and magnitude/phase linearity. These are important to enable efficient debug and validation of RF/uW/mmW targets.
Wideband Options For Oscilloscope-Based Measurement Systems
High bandwidth oscilloscopes can be used for wideband RF measurements in a number of ways, including standalone or in conjunction with various down converters. One way to consider options for wideband measurements is to plot approaches on a chart with a vertical axis representing analysis bandwidth of a measurement solution and a horizontal axis representing the carrier frequency that can be measured. Such a graphic is shown in Figure 1.

Notice that classic signal analyzers offer analysis bandwidths up to 1 GHz, and they can handle carrier frequencies up to around 50 GHz. The limit in analysis bandwidth has been 510 MHz for several years until just recently. As an alternative, mid-range oscilloscopes offer bandwidths in the 8 GHz range, allowing measurements on signals with carrier frequencies approaching 8 GHz, and with very wide modulation bandwidths, even approaching 8 GHz. As long as the carrier plus modulation spectrum fits within the oscilloscope bandwidth, then meaningful measurements can be made.
In wideband aerospace/defense applications, including EW, radar, and surveillance, carrier frequencies of signals of interest often are higher than 8 GHz, prompting the use of high-performance oscilloscopes. There are oscilloscope families available with bandwidths up to 33 GHz and 63 GHz.
Such oscilloscopes do carry with them a significant price tag, but they offer impressive performance in areas like frequency response flatness and low noise. An alternative is to place a down converter in front of a mid-range oscilloscope. This results in lower-priced solutions that still can handle high carrier frequency signals with wideband modulation, but with some tradeoff in amplitude and phase linearity.
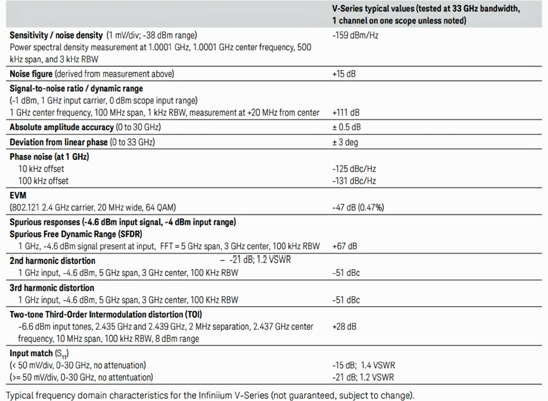
Table 1. Typical RF performance in a high-bandwidth oscilloscope.
A first down converter option is to place a standard signal analyzer in front of a mid-range scope and use the IF down conversion path in the signal analyzer to perform the down conversion. Calibration is typically needed to flatten the overall system amplitude and phase response over frequency. Such a solution can address a wide range of carrier frequencies, typically up to around 50 GHz.
A second down converter option is to place a lower cost harmonic mixer in front of a mid-range scope as the down converter. This results in a “banded” solution, where very high carrier frequencies can be analyzed but there is generally a “band” of carrier frequencies that a particular harmonic mixer can handle. This makes this second option especially convenient for applications like 5G, Wigig and automotive radar.
Typical RF Performance For High Bandwidth, Real-Time Oscilloscopes
Before making FFT or wideband RF measurements with an oscilloscope or oscilloscope combined with vector signal analysis software, it is helpful to evaluate the RF characteristics of the oscilloscope because this can have a major influence upon the result of such measurements.
Today, oscilloscopes are available which incorporate amplitude and phase correction with the result of excellent absolute amplitude accuracy and low deviation from linear phase across the oscilloscopes’ frequency range, which in turn contributes to high quality RF measurements. These oscilloscopes also offer excellent noise densities, in the vicinity of -160 dBm per hertz, and high dynamic range and signal-to-noise ratios, considering the wide bandwidth capability they offer. This enables a designer to be able to look at very small amplitude wideband signals adjacent in time to large signals, or to be able to boost scope sensitivity to measure isolated, small amplitude signals.
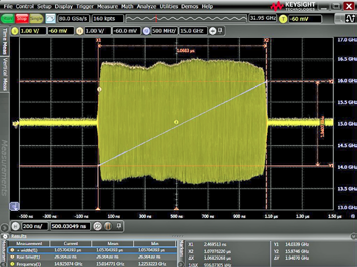
Figure 2. Time domain measurements on 1 usec wide, 15 GHz carrier, 2 GHz wide linear FM chirped RF pulse with a 33 GHz bandwidth osc
The time base circuitry in these oscilloscopes also results in good, close-in phase noise, which corresponds to low jitter in very deep memory traces. RF characteristics of a high-performance 33 GHz bandwidth oscilloscope are shown in Table 1 on the next page.
Wideband Pulsed RF Time Domain Measurements
The first topic to consider is the time domain measurement and analysis of wideband pulsed RF signals using high-bandwidth oscilloscopes standalone. The choice of which scope to use depends on the maximum frequency content of the carrier plus modulation. Consider an example where a signal under test is supposed to have 1 usec wide pulses, with a pulse repetition interval of 100 usec. It also has an RF carrier frequency of 15 GHz, and linear FM chirping that is 2 GHz wide.
A view of a variety of measurements on a single RF pulse, including envelope parameters and the frequency chirp across the pulse can be seen in Figure 2.
Stable triggering on this pulse is accomplished with trigger “holdoff” set to a value slightly longer than the 1 usec RF pulse width.
To make amplitude measurements, the “Envelope” math function is used and then pulse measurements are dropped down onto the visible RF pulse envelope. A “frequency” measurement is dropped down onto the RF pulse (not onto the envelope), and a “Measurement Trend” math function is defined with the frequency measurement as a source.
Next a smoothing math function is performed on the measurement trend with the resultant linear ramp display of the linear FM chirp modulation, also shown in Figure 2.
The oscilloscope magnitude linearity over the frequency span of interest has a direct effect upon the quality of the envelope measurement. A magnitude plot over frequency of typical RF performance of the 33 GHz bandwidth scope is shown in Figure 3.
Wideband Pulsed RF Gated FFT Measurement Of Spectrum
Another important set of measurements includes wideband FFTs and time gated FFTs. A wideband FFT can be created by defining an “FFT Magnitude” math function with “Rectangular” windowing.
A time gated FFT is then possible through the use of the “Timing Gate” math function. Once the time gating math function is defined, an FFT math function can be defined that is calculated from the time record within the time gate, as shown in Figure 4 on the next page.
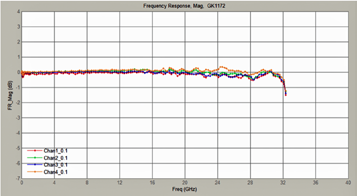
Figure 3. Typical magnitude linearity over frequency on four individual 33 GHz channels
Wideband Pulsed RF Time & Frequency Domain Measurements With A Scope Plus Vector Analysis Software
RF and FFT measurements with high bandwidth oscilloscopes can be further enhanced through importing oscilloscope-captured signals into vector signal analysis software. Some advantages of using such analysis software include:
• Host of built in RF measurements
• Ability to bandpass-filter oscilloscope input samples and decimate prior to the FFT calculation to reduce noise and speed the FFT calculation
• Variety of digital and analog demodulation options like QAM16 and FM demodulation
• Time domain baseband view of pulse with reduced noise through processing gain
• The frequency and phase shift across the pulse through a demodulator
It is interesting to look more closely at the extension of measurement signal-to-noise ratio through processing gain. VSA software has the capability to bandpass filter the acquired oscilloscope data and resample the data at a lower sample rate resulting in lower noise, higher dynamic range, and a wider signal-to-noise ratio.
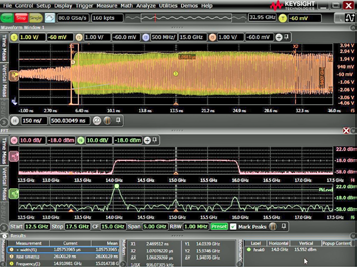
Figure 4. View of normal and time-gated FFT and display with time gate at the beginning of the RF pulse.
If the oscilloscope-captured data is imported to vector signal analysis software, it can be digitally down-converted into I and Q baseband data, bandpass filtered, and then resampled. This process can greatly decrease the amount of noise in the measurement. Essentially, the process is “tuning” to the center frequency of the signal, and “zooming” into the signal to analyze the modulation. This is also referred to “processing gain.”
In this example, the original 8 GHz wide measurement with the associated noise is reduced to a 500 MHz-wide measurement, centered on the 3.7 GHz carrier with an instantaneous measurement bandwidth slightly wider than the width of the signal modulation. This corresponds to an improvement in signal-to-noise ratio of:
• 10log*(ScopeBW/Span) = 10log*(8E+09/500E+6) = 12 dB.
• SNR is improved by 10log*(ScopeBW/Span)
Taking advantage of this processing gain, combined with the vector signal analysis software’s ability to have a log magnitude scale, and using averaging, the 50 dB down pulse is now visible as shown in Figure 5. It was not visible in the oscilloscope display with the 8 GHz wide measurement.
Use of oscilloscope segmented memory together with VSA pulse option BHQ for long target time capture and statistical pulse analysis
When an oscilloscope is used to sample a wideband RF signal, it must sample at a fast enough rate to accurately capture the carrier plus modulation. This means that often a very fast sample rate is required, which also means in a normal real-time sampling mode, the oscilloscope memory will not allow for a very long capture period.
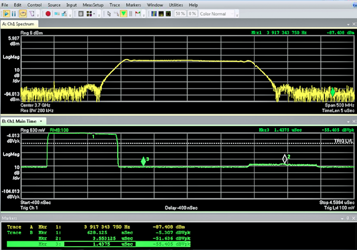
Figure 5. 50 dB down pulse seen with vector signal analysis software “Center Frequency” and “Span” set.
A method that can greatly increase the target activity time when there is a low-duty cycle signal, such as a common pulsed RF radar signal, is to use an oscilloscope feature called segmented memory. Here, the scope memory is divided into smaller segments of fixed time width, chosen to be a little wider than the widest RF pulse.
The scope triggers on an event, such as the beginning of the RF pulse, and then places one RF pulse in a segment of memory. The scope then stops capturing data, rearms the trigger, and waits for the next RF pulse to occur. A second RF pulse is put into the second segment of memory. This process continues until all the scope memory segments are used.
Modern pulse analysis software can allow the user to takes advantage of the oscilloscope segmented memory, and then offers many built-in measurements for pulsed RF signals. A capture of many RF pulses, through the use of segmented memory in the oscilloscope, combined with pulse parameter measurements built into the pulse analysis software, is shown in Figure 6 on the next page, where a measured 1 GHz linear FM chirp and related phase shift across pulses is compared to a best fit ideal linear ramp and ideal parabola respectively. A close-up view is made of the delta between measured and reference for frequency in trace S and for phase in trace J.
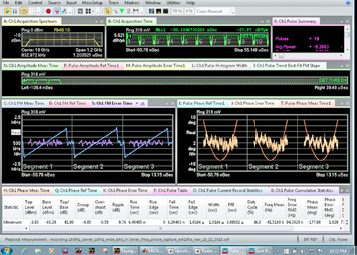
Figure 6. Pulse analysis software calculations based on measurements taken on oscilloscope segmented memory.
An increasing number of designs have modulation bandwidths greater than the 510 MHz of instantaneous measurement bandwidth which has been available in signal analyzers and spectrum analyzers the last number of years. Some designs are now even moving beyond the 1 GHz analysis bandwidth that can be found in the signal analyzer market today. This is driving designers to use digitizers and oscilloscopes which offer enough bandwidth and sample rate to directly sample the carrier plus modulation, or to place down-converters in front of oscilloscopes.
Math functions like envelope, measurement trend, and FFT have all proven very helpful to understand target system operation and issues. Combining an oscilloscope with vector signal analysis software creates a powerful RF measurement suite to perform a wide range of measurements, including demodulation, extended signal to noise ratio time domain views, and statistical RF pulse analysis.
Although there is a tradeoff between dynamic range/SNR and the instantaneous bandwidth available, many helpful wideband measurements are possible to assist an engineer in evaluating a prototype or production unit.
keysight.com

Brad Frieden is a Product Planner / Product Marketing Engineer for the Oscilloscopes and Protocol Division of Keysight and has been focused on general purpose logic analyzers and related applications, as well as
Aerospace/Defense related RF measurements using high-bandwidth, deep memory oscilloscopes.
He has been with HP/Agilent for 30 years and has been involved in a variety of marketing roles in areas that have included fiber optic test, pulse generators, oscilloscopes, and logic analyzers. He received his BSEE from Texas Tech in 1981 and his MSEE from The University of Texas at Austin in 1991.