
Electronic equipment used in Communications-on-the-Move (COTM), or airborne applications similar to what is shown in Figure 1, can be exposed to mechanical vibration.
Standards such as RTCA/DO-160 or MIL-STD-810[1] [2] define a set of environmental conditions, including vibration, under which the equipment is expected to maintain a satisfactory performance. Among all communication equipment, synthesizers and, thus, block upconverters (BUC) are known to be susceptible to vibration.
The problem can be mitigated at the circuit and system design levels. At the circuit design level, modifying some electrical parameters such as the phase-locked loop filter bandwidth can decrease the susceptibility to vibration[3].At the system level, using vibration isolators may prove effective. This article focuses on the use of vibration isolators and the mechanical aspects of mounting the synthesizer printed circuit board inside a BUC.
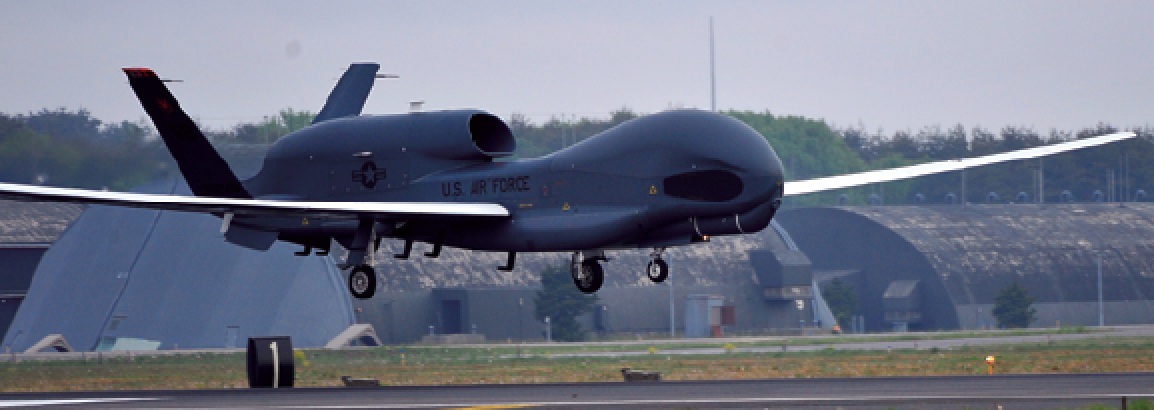
Figure 1. A military aircraft equipped with communication devices
To measure the susceptibility to vibration of a synthesizer usually phase noise (PN) and jitter are used. The phase noise is the deviation of an amplifier or synthesizer from its expected frequency. The frequency contents of a supposedly sinusoidal signal at frequencies adjacent to its center frequency is plotted against the offset frequency with respect to the total power of the signal. Presented are the single side band (SSB) phase noise plots for an offset frequency range of 10 Hz to 100 MHz. A certain type of vibration may have different effects on different subsections of the offset frequency range, hence the shape of the PN curves are important as they answer the question of how the vibration affects the phase noise of a device.
To answer the question of how much in total the phase noise is affected by vibration, a single value, the integrated phase noise (IPN) is used. The IPN, expressed in radians, is equal to the square root of twice the integral of the SSB phase noise in the desired offset range. The jitter, measured in seconds, is a time domain parameter which measures the deviations from the periodicity of a signal and is equal to the IPN divided by the angular frequency of the main signal. We discuss the phase noise results only as the jitter can be directly determined from the IPN and center frequency.
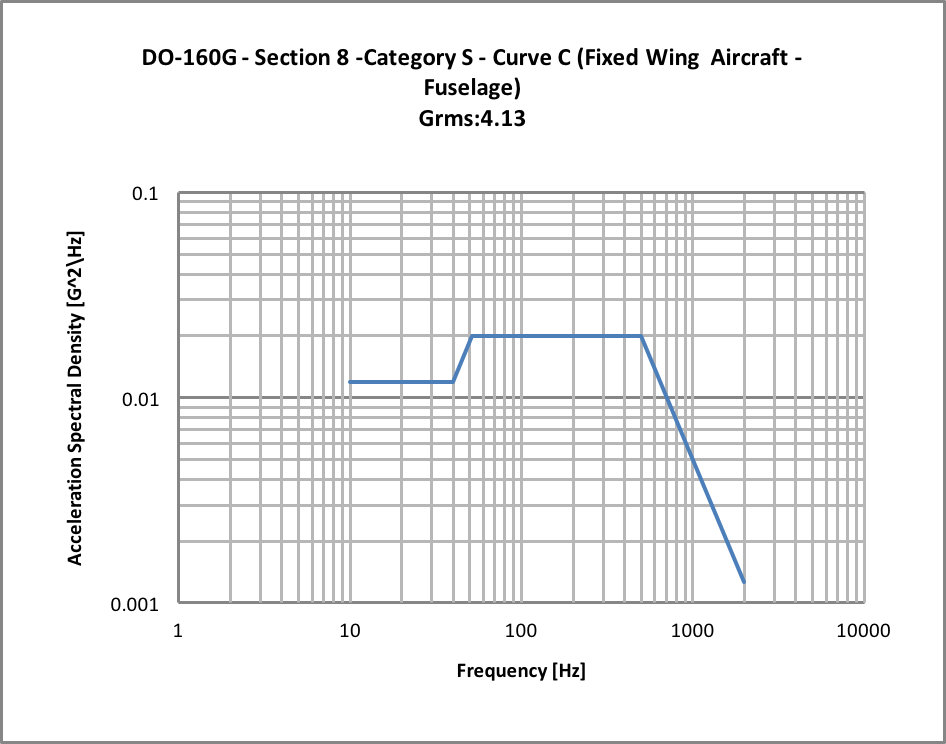 Figure 2. The acceleration spectral density of the 160G-8SC vibration profile
Both PN and jitter represent some component-level behavior of the synthesizer or the BUC. To investigate the system-level effects, the bit error rate (BER) is used in a RF loop back system which is explained later in the article.
The synthesizer of a 25W Ka-band Norsat ATOM BUC prototype is used to conduct this investigation. To reduce the number of unknowns, we limited the scope of the investigation. A BUC has several boards, and each might have certain sensitivity to vibration. However, the synthesizer, by far, is the most susceptible part in the BUC to vibration.
Other blocks, such as the SSPA, have negligible sensitivity to vibration compared to the synthesizer4. In this investigation, the authors expose only the synthesizer to vibration. Fortunately, anticipating vibration-related issues, the Norsat synthesizer board was designed and implemented on a separate printed-circuit board (PCB) to facilitate isolation. Therefore, the synthesizer board connections were extended in order to bring it out of the BUC and mount it on the vibration table. Although all sub-assemblies of the BUC are part of the test setup, the synthesizer board is the only component in vibration.
In this article, the PN of the BUC and the BER of an RF loopback system when no vibration is present is measured and then the problem when vibrations of different intensities in two different dimensions are applied to the synthesizer board with no vibration isolators are demonstrated. Then the effects of two different vibration isolators are investigated. At last, some recommendations are presented to improve the vibration isolation in future design revisions.
I. Vibration Profiles and Isolators
Satellite COTM refers to a ground, maritime, or airborne vehicle equipped with an antenna system capable of maintaining communication while in transit. The antenna system, and therefore the BUC, is mounted to the vehicle which exposes the system to vibration produced by the vehicle and its interactions with the medium it is transiting on/through (ground, water, air).
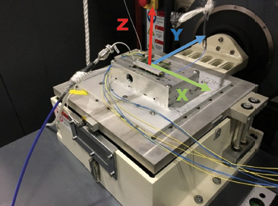
Figure 3. Synthesizer board on vibration table.
The vibrating environment from a given COTM application can be recorded by taking measurements from an accelerometer, from which a statistical representation of that recording, its vibration profile, can be generated. The vibration profile can be later played back on an electrodynamic shaker with a capable controller that effectively emulates the vibration seen by the system in a real COTM environment.
Emulating the vibration environment in a lab reduced the need to qualify a product in situ and allows for testing to be performed earlier in development than possible otherwise. Various standards (see MIL-STD-810G[1], RTCA/DO-160G[2], IEC 60068-2-64[5] have cataloged vibration profiles across a broad array of ground, maritime, and airborne vehicle models and environments.
A review of vibration profiles presented in MIL-STD-810 Method 5.14 shows a general trend of increasing harshness of vibration from maritime shipboard environments to ground transport and then to airborne applications having the most extreme operating environments.
A single airborne vibration profile was selected to measure the performance of the BUC against, DO-160G - Section 8 - Category S – Curve C (Fixed Wing Aircraft – Fuselage). This curve is closely matched by MIL-STD-810G – Figure 514.6C-5 Jet Aircraft Cargo “General Exposure.” The selected profile’s acceleration spectral density (ASD) curve is shown in Figure 2. This profile will be referred to as the 160G-8SC profile.
Just as gaskets are used to isolate the internal environment of the BUC from external moisture and dust, elastomeric mounts are used to provide passive isolation of the BUC’s structure and sensitive internal circuitry to vibration exposure from the operating environment. These mounts come in a variety of geometries, load ratings, stiffnesses, and materials that dictate the vibration transmissibility of each mount which can be chosen to suit the environment and application.
In this series of tests, the performance of the BUC is measured in a small array of mounting configurations comparing rigid mounts to isolated mounts while only the synthesizer board is exposed to the selected vibration profile. The two isolating mounts used in this round of testing, type A and type B, have similar load ratings, stiffnesses, and construction but their material and geometry differ, suggesting that their vibration transmissibility may as well. One purpose of this test is to determine how these differing properties will impact the phase noise and in what way.
II. Test Method
The phase noise of the BUC and the BER are measured while the synthesizer board is both at rest and exposed to vibration first in x and then in y dimension. The vibration table provides vibration only in one dimension. We mount the device in different orientations to achieve vibration in different dimensions.
The BUC is opened, and the connection cables of the synthesizer board are extended to allow its mounting on the vibration table. As a baseline measurement, the synthesizer is mounted using rigid standoffs and the phase noise and BER are measured with no vibration in effect. The measurements are repeated for different vibration intensities of 5, 10, 25, 50 and 100 percent, first in x and then in y direction. The 100 percent intensity is the 160G-8SC profile.
The rigid standoffs are replaced with type A isolators and the measurement is repeated in the two directions and with different vibration intensities. Then type A isolators are replaced with type B isolators and the tests are repeated.
The test setups are explained as follows.
a. Phase Noise Measurement
The SSB phase noise of the BUC in Ka-band is measured for the 10 Hz to 100 MHz range by a spectrum analyzer. The spectrum analyzer also directly provides the IPN and jitter.
b. Bit Error Rate Measurement
The BER can be measured building an RF loop where the BER measurement device is connected to the modem. The transmit port of the modem is connected to the BUC which is connected to a test loop translator (TLT). The TLT is connected to a low-noise block which is then connected to the receive port of the modem through a noise generator. The noise generator is used to decrease the signal-to-noise ratio without having to decrease the signal power to the detection threshold of the modem.
The modem provides a QPSK modulation with ½ Viterbi coding and all power levels and attenuations are adjusted such at the (C+N)/N of the received signal at the modem is approximately 6.8 dB (theoretically equivalent to an Eb/N0 of 5.8 dB when the symbol rate is equal to the bit rate that is 2048 kbps) and the modem measures an Eb/N0 of about 5.5 dB. This Eb/N0 was chosen because it leads to a BER at the order of 1E-7 which stabilizes in a reasonably short time and also if it degrades even by three or four orders of magnitude, the modem usually is still capable of maintaining a receive lock. This tolerance for degradation in the BER allows for a quantitative measurement of the vibration effects.
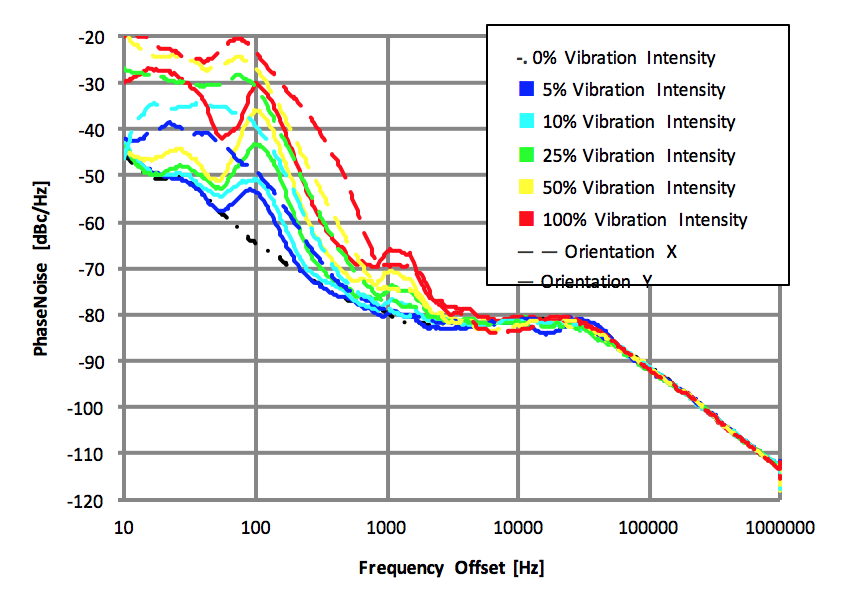 Figure 5. Phase noise of the BUC while the synthesizer is on type A mounts.
 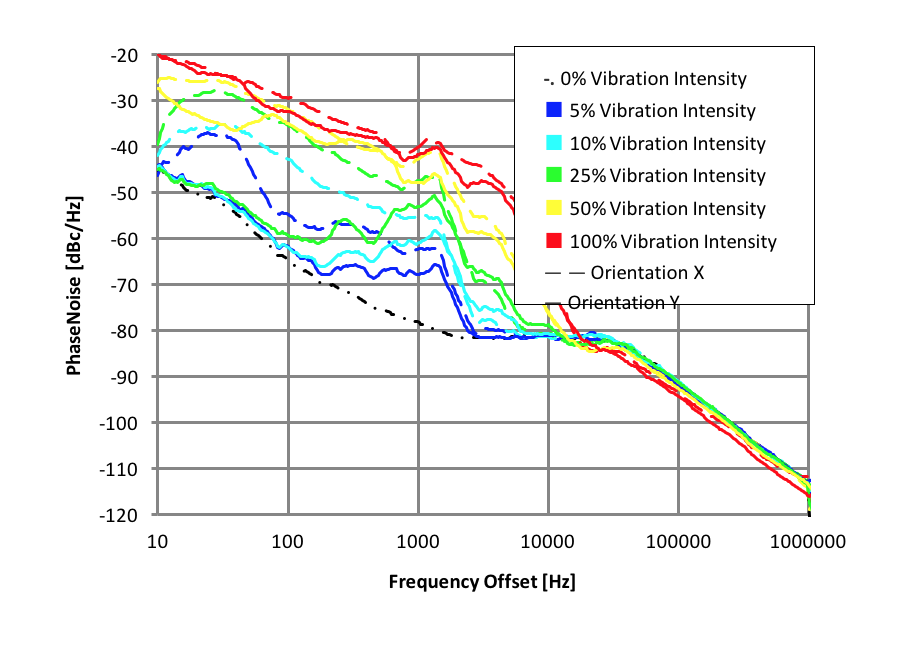 Figure 4. Phase noise of the BUC while the synthesizer is on rigid mounts. The color defines vibration intensity as specified in the legend. Dashed and solid color curves indicate vibration in x and y directions respectively. Black dash/dot curve indicates no vibration.
III. Results
The results are presented in this section and analyzed in the following section.
a. The Synthesizer on Rigid Mounts
The synthesizer board, after extending its cable connections, is mounted on the vibration table using rigid screws. The phase noise of the BUC, and the BER are measured while the synthesizer is at rest and while exposed to vibrations of different intensities at x and y directions.
Figure 3 presents a picture of the synthesizer board on the vibration table and Figure 4 shows the phase noise plots of the BUC for a range of 10 Hz to 100 MHz. All results are summarized in Table 1 placed later in this article, where BER values are reported only if the modem maintains the link.
The phase noise curve of the baseline measurement, i.e. the 0 percent vibration intensity, is below the rest as expected. It yields an IPN of 44.6 mrad and a steady BER of 3E-7 is measured. From Figure 4, it is evident that (a) the phase noise is raised significantly as vibration intensity increases for offset frequencies of less than 1 MHz, and (b) that the increase in the phase noise is more severe when the vibration is in x direction.
b. Synthesizer on Type A Mounts
The rigid mounting screws are removed, and the synthesizer is connected to the table using the type A vibration mounts. The phase noise, jitter, and BER are measured while the synthesizer is exposed to vibrations of different intensities at all directions, and the phase noise plots are shown in Figure 5.
Comparing the dashed curves to those in Figure 4, observe that in x direction the improvements are negligible. Even at 5 percent vibration rate, no BER could be measured as the modem cannot maintain the receive lock. In y direction, some improvements are seen such that at 25 percent intensity, the communication link at the BER test is maintained and a steady BER of 5E-6 is observed.
Whether the situation can be improved by using a different set of vibration mounts is what we aim to answer in the following subsection.
c. Synthesizer on type B Mounts
The phase noise plots of the synthesizer on type B soft mounts are presented in Figure 6.
Observe that there is no benefit in using type B mounts. In fact, at 25 percent vibration intensity in y direction, type A mounts provide better isolation and lead to an IPN of 87.67 mrad, compared to 127.2 mrad with type B. It is only with the type A isolators that the modem receive lock is maintained and a BER becomes achievable at this vibration intensity.
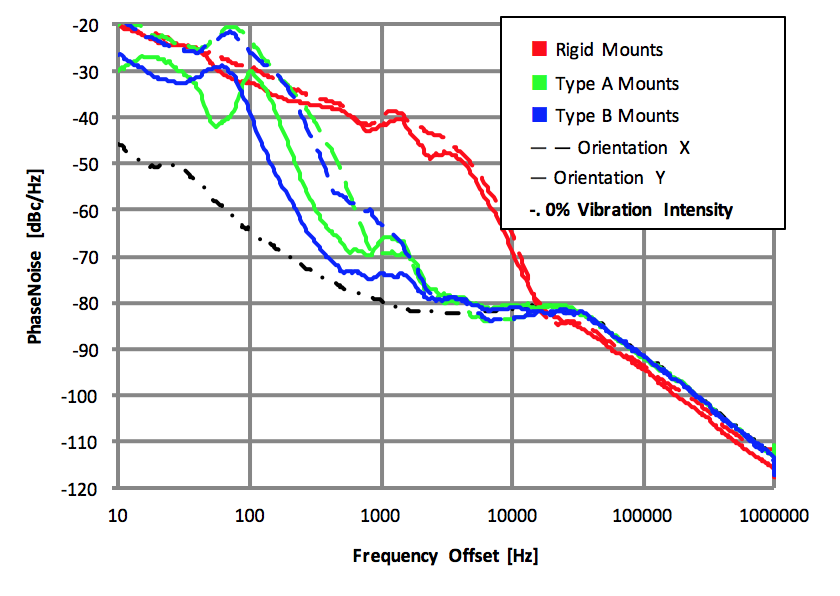 Figure 7. Phase Noise of the BUC at 100% intensity for each mount type and vibration direction.
 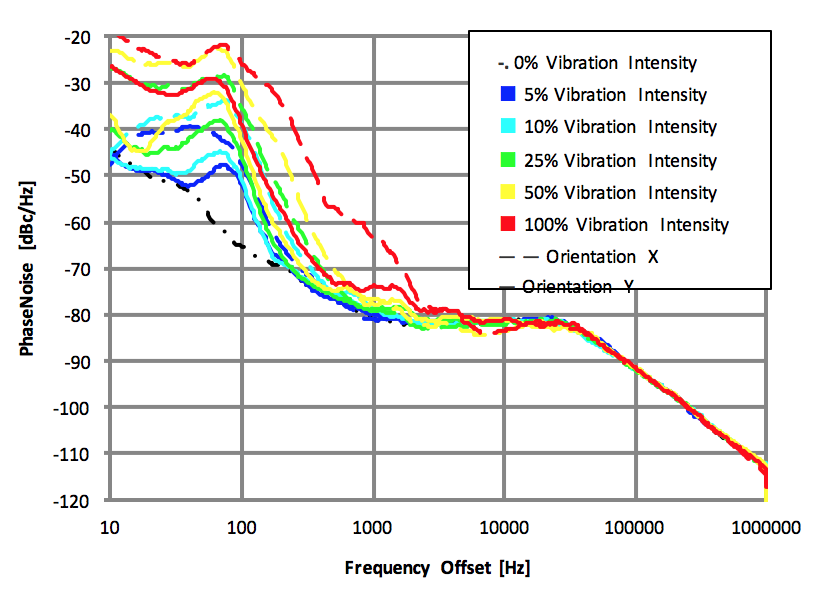 Figure 6. Phase noise of the BUC while the synthesizer is on type B mounts
IV. Analysis
The results are discussed in this section and to summarize all the phase noise results, Figure 7 and Figure 8 are presented.
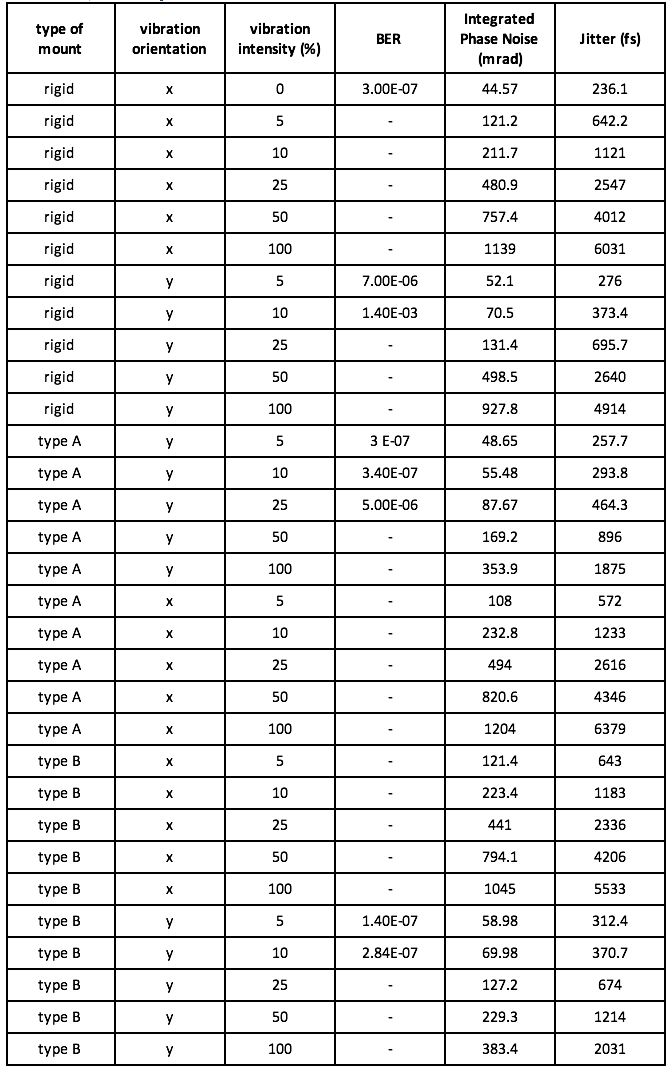
Table 1 BER, IPN and jitter values.
Figure 7 presents the phase noise of the BUC at 100 percent vibration intensity. It is seen that at both x and y directions, even with the rigid mounts the phase noise is not more than the phase noise of the case with 0 percent intensity for offset frequencies more than 20 kHz, indicating that most of the attention must be paid to the range 10 Hz to 20 kHz when choosing vibration isolators.
In Figure 7, it is seen that at around 70 to 80 Hz and when vibration is in x direction, the phase noise values of type A and type B cases are higher than when rigid mounts were used. The absence of this behavior in the y direction vibration indicates that the synthesizer board with the current soft mounts and their asymmetric 3-screw mounting pattern may have a natural mechanical oscillation in x direction around this frequency.
In the y direction (solid green and blue curves), at around 65 Hz, type A and B curves behave in opposite ways. While type A delivers considerable mitigation, type B does not offer any improvement. For the 150-1000 Hz range, type B mounts lead to smaller phase noise values, almost appearing to cancel out the effect at the interval around 65 Hz. Hence one would expect similar IPN and BER results for both type A and B. Table 1 (next page), at 100 percent vibration intensity, confirms this prediction by showing similar IPN values 353.9 and 383.4 mrad.
The frequency response of the vibration isolators may play an important role as the vibration profile is usually frequency-dependent. In Figure 2, it is shown that the vibration increases to its full value at 50 Hz. As mentioned previously, it is seen in Figure 7, that types A and B isolators behave very differently at around 65 Hz. Hence the shape of the vibration profile together with the frequency response of the vibration mounts will play a major role in determining which type of isolation should be used.
Figure 8 shows that the effectiveness of the vibration isolators of both types in reducing the IPN increases as the y-direction vibration intensity increases. For example, type A mounts reduce the IPN from 131.4 mrad with rigid mounts to 87.67 mrad at 25 percent vibration intensity whereas in the case of the 100 percent vibration intensity, type A mounts reduce IPN from 927.8 to 353.9 mrad which is a reduction by a considerable factor of about 2.6.
As a result, one would expect to see more significant improvements in the BER rates at higher vibration intensities. However, Table 1 shows that, at higher vibration intensities, using vibration isolators does not lead to sufficient improvements in the system performance and the modem is still incapable of demodulating the signal.
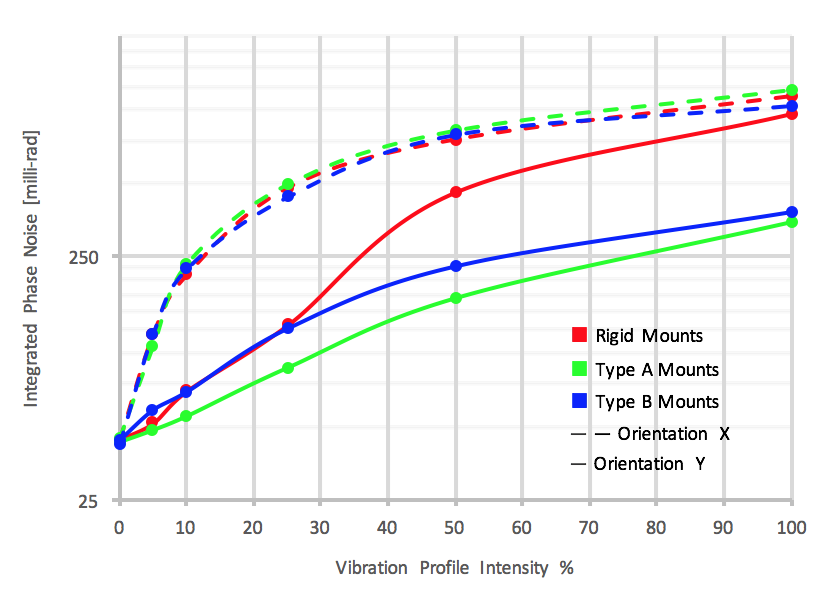 Figure 8. Integrated phase noise increases with vibration intensity. The type A mounts reduce phase noise only if the vibration is in y direction. The effectiveness of the type A mounts in y direction increases with vibration intensity.
At the lower intensity of 5 percent, type A mounts decrease the BER from 7E-6 to 3E-7, which is an improvement by a factor of 23. At 10 percent vibration intensity the improvement factor, compared to the rigid mounts, is more than 4000. At the 25 percent intensity, where no link was present with the rigid mounts, type A isolators enable to modem to maintain a link. Hence, although the effectiveness (with respect to IPN) of types A and B vibration isolators increase with vibration intensity, their overall advantage in assisting the modem to maintain a loopback link is negligible at higher vibration intensities.
Table 1 and Figure 8 both show that type A isolators are more effective than type B for vibrations in the y direction.
Type A and type B mounts behave similarly when vibration is in x direction and offer almost no improvement. The BER results in Table 1 and Figure 8 show that the soft mounts prove useful only in y direction. The authors speculate that asymmetries in the mounting hole pattern relative to the center of mass of the synthesizer is one contribution to the difference in the effects of vibrations in difference directions.
V. Conclusion
Mechanical vibration can affect the phase noise and signal quality severely. Mounting the synthesizer board on vibration isolators can reduce the phase noise and increase signal quality. The Norsat ATOM BUC separates the synthesizer board and allows space for its internal mounting on vibration isolators.
Attention must be paid to mount the synthesizer board properly. The size and weight of the board will determine how many screws and what mounting hole pattern is required to mount the synthesizer board inside the BUC.
Vibration isolator must be chosen considering both the intensity and frequency contents of the vibrations present in the environment and the physical characteristics of the product. Considering a vibration profile similar to 160G-8SC, and the size and weight of our synthesizer board, type A isolators have shown to offer better performance over the type B counterparts.
To further reduce the sensitivity to vibration, the user can mount the BUC using external isolators if required.
www.norsat.com
References
1DO, RTCA. “160G.” Environmental conditions and test procedures for airborne equipment (2010).
2FORCE, AIR, and Air Force Sustainment Center-Oklahoma City. “MIL-STD-810G.” (2008).
3N. Sood and P. Sen, “Optimizing performance of phase locked oscillator for high vibration environment,” 2015 IEEE MTT-S International Microwave and RF Conference (IMaRC), Hyderabad, 2015, pp. 220-223.
4Norsat International Inc Internal Report, “REP000174_r1.0 Vibration Test Report for the ATOM 50W BUC”
5IEC-60068-2-64. “Environmental testing–Part 2–64: Tests-Test Fh: Vibration, broadband random and guidance.” (2008).